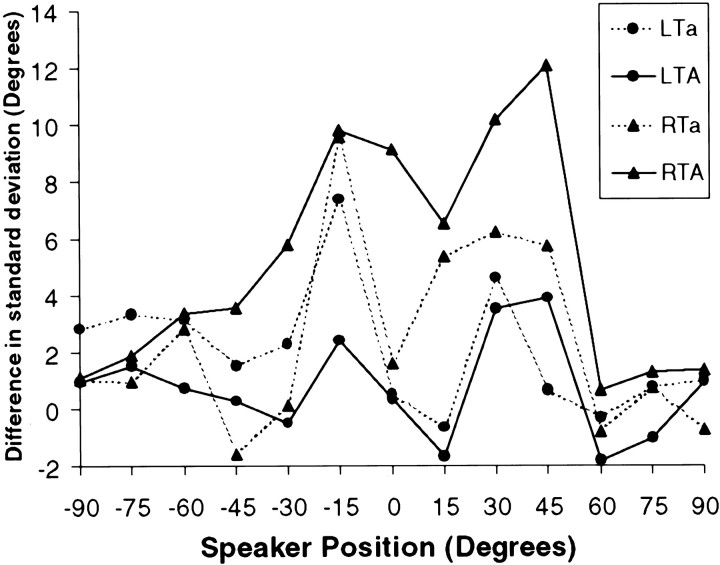
Fig. 4.
SD of responses in the localization task as a function of position. The ordinate plots the difference in SD between the control group and the four lesion groups (positive numbers indicate greater dispersion in the responses than normal). Only the RTA group demonstrated significantly elevated SD (see Results).

