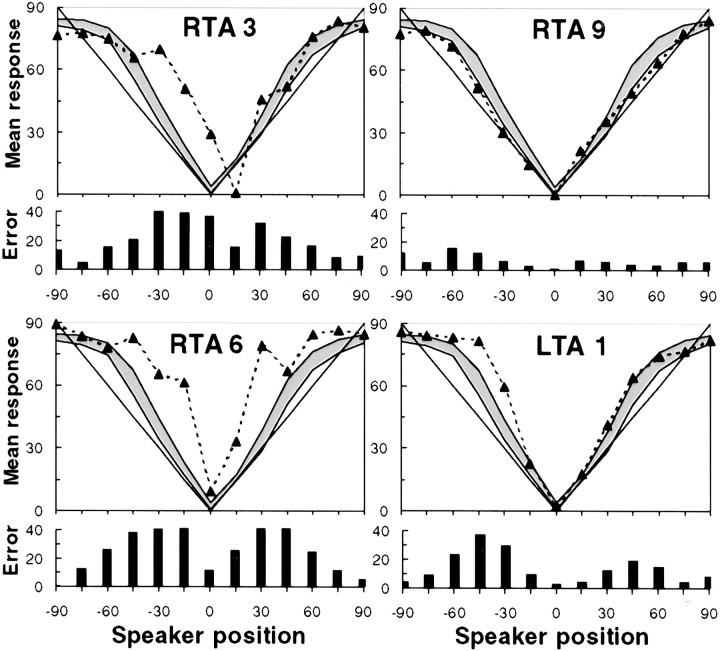
Fig. 5.
Individual localization performance on pointing task for four selected patients. The top of eachpanel shows the subject's mean localization responses (dotted line), as well as the range of responses from the normal control sample (shaded area indicates mean ± 2 SEs), as a function of azimuth position; solid line represents perfect responses. The bottom of each panel shows the mean absolute error. Note the severe localization errors made by patients RTA3 and RTA6 in both hemifields, whereas patient RTA9 was unimpaired. Patient LTA1 showed significant disturbance primarily in the left hemifield.

