
Fig. 4.
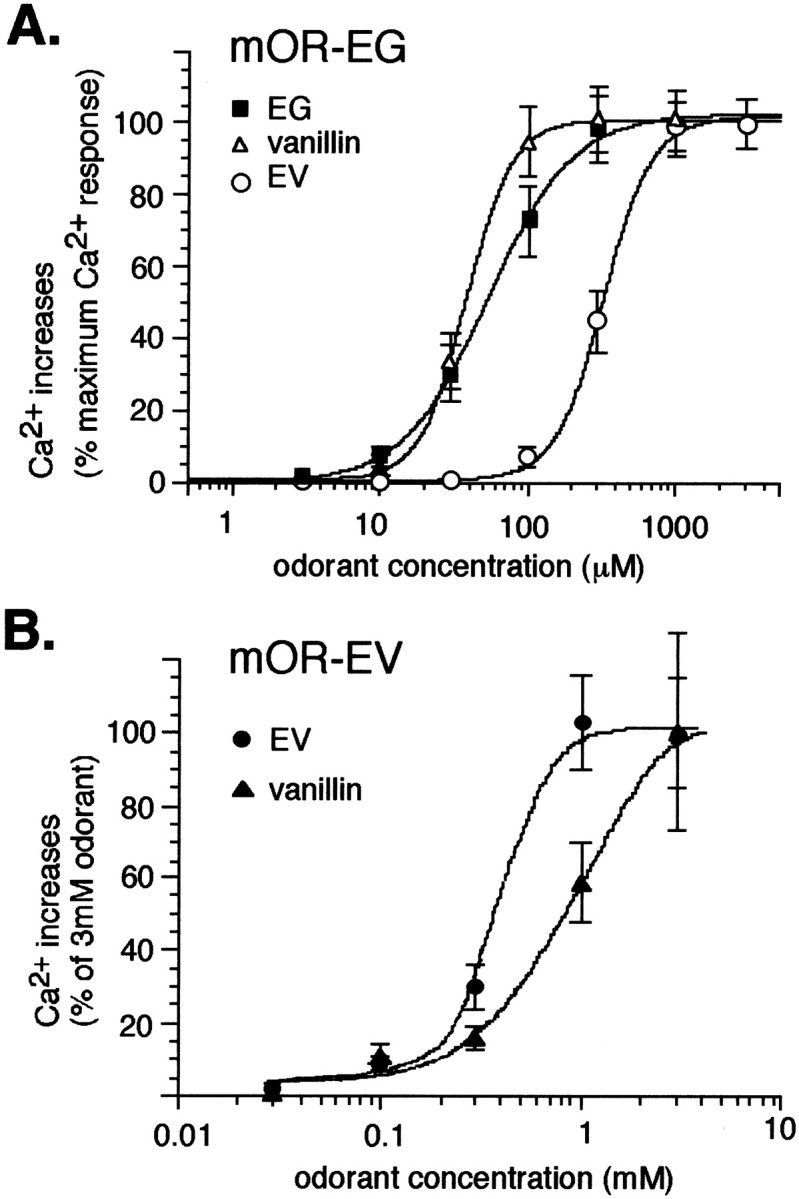
A, Dose–response curves of the mOR-EG to EG, EV, and vanillin, obtained from Ca2+increases as a percentage of the responses at the highest concentrations of odorants. The maximum responses by ligand odorants were approximately the same. Each point represents the mean ± SE from at least 20 responding cells. B, Dose–response curves of Ca2+ responses of the mOR-EV to EV and vanillin. The data are shown as a percentage of the responses at 3 mm odorant concentrations. Eachpoint represents the mean ± SE from 11–36 cells in three to six separate experiments starting at different concentrations as described in Materials and Methods.