Fig. 1.
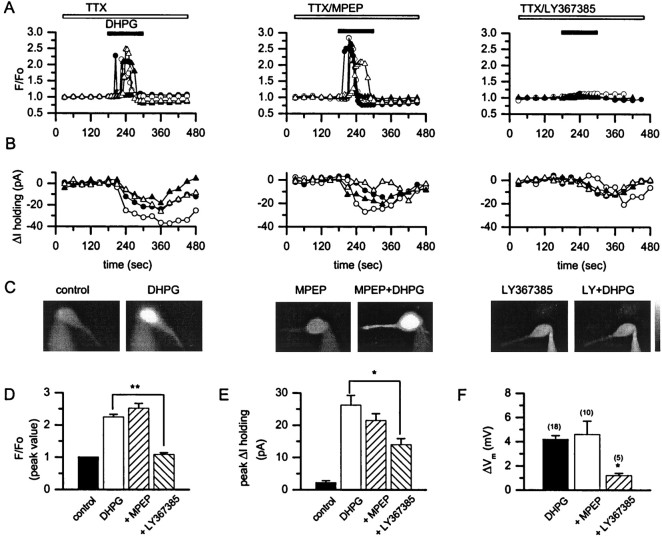
mGluR1 mediates the DHPG-induced increase in [Ca2+]i and inward currents simultaneously recorded from CA1 hippocampal neurons. A, B, Time course of the effect of 30 μm DHPG alone (left) and in the presence of 10 μm MPEP (middle) or 100 μm LY367385 (right) on fluo-3 fluorescence and on holding current obtained in four different CA1 pyramidal neurons. Eachsymbol represents a different cell. Antagonists and 1 μm TTX were applied for 10 min before the recordings were started. The horizontal bars for drug application inA also apply to B. C, A typical example of mGluR-mediated increase in somatic fluo-3 fluorescence measured in three different CA1 pyramidal neurons. Shown are DHPG alone (left) or in the presence of 10 μm MPEP (middle) or 100 μmLY367385 (right). D–F, Bar graphs expressing the highest values ofF/Fo ratio of fluo-3 fluorescence (D), peak inward current (E), and peak depolarization (F) induced by DHPG application alone or in the presence of 10 μm MPEP or 100–300 μm LY367385. Values are the means ± SEM; n = 4 in Dand E and is indicated in parentheses inF. *p < 0.05; **p < 0.01; Student's t test.

