Fig. 4.
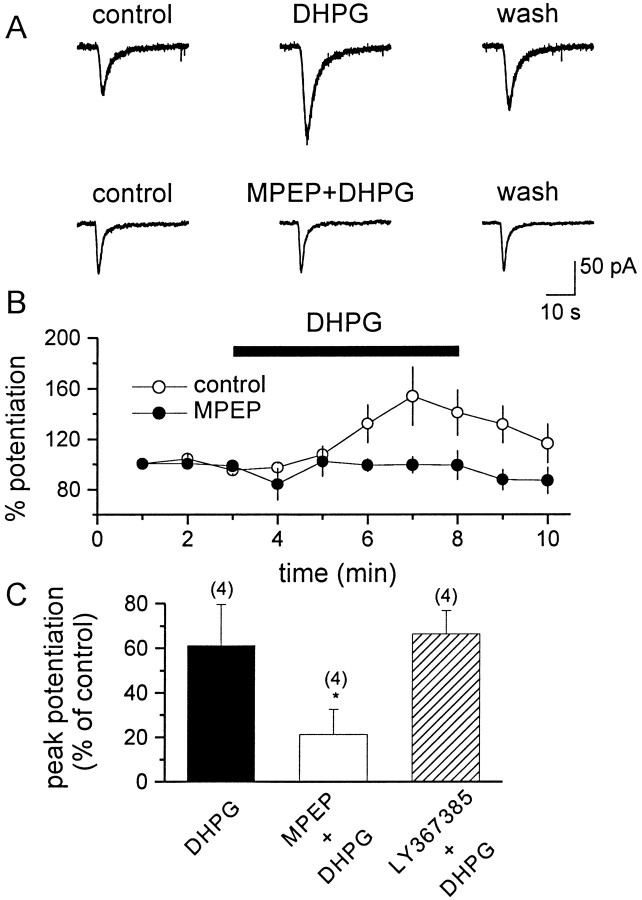
MPEP antagonizes the DHPG-induced potentiation of NMDA currents in CA1 pyramidal cells. A, Representative traces demonstrate the DHPG-induced potentiation of NMDA currents (top traces) and its block by preincubation with 10 μm MPEP (bottom traces). B, Average time course showing the effect of DHPG (open circles) and its antagonism by 10 μm MPEP (filled circles). C, Bar graph showing the mean effect of DHPG on NMDA current alone and in the presence of MPEP or LY367385. The number of cells that have been tested is in parentheses; values are the means ± SEM of the data, expressed as peak potentiation of control values. *p < 0.05; Student'st test.

