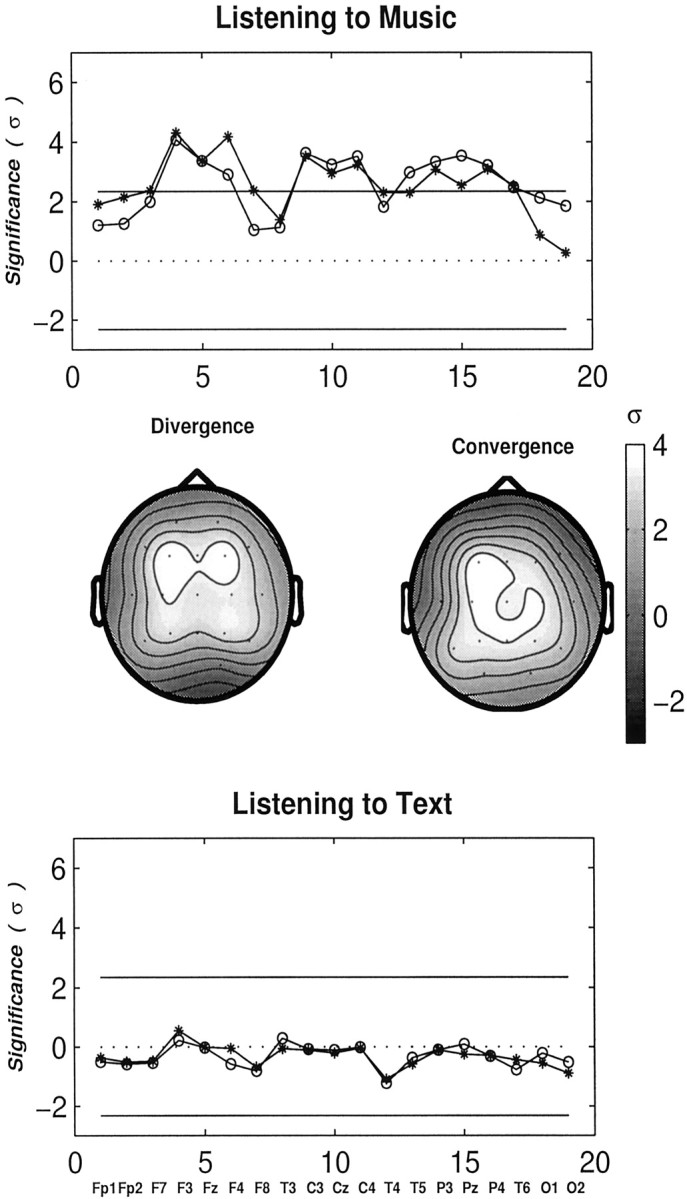
Fig. 7.

Profiles showing the degrees of relative interdependencies (in units of ς) in the γ band for musicians relative to non-musicians at task conditions columns: listening to music (top), and to a text of neutral content (bottom). Symbols are the same as in Figure 6. Large and significant increases in long-range synchrony in the γ band over multiple electrode regions are found in musicians while listening to music, particularly in and near midline regions. These profiles are also presented as scalp maps exhibiting the two different attributes (convergence and divergence) of individual electrode regions. ς is coded from black to white as the value increases. Text processing does not produce any difference between the two groups.
