
Fig. 2.
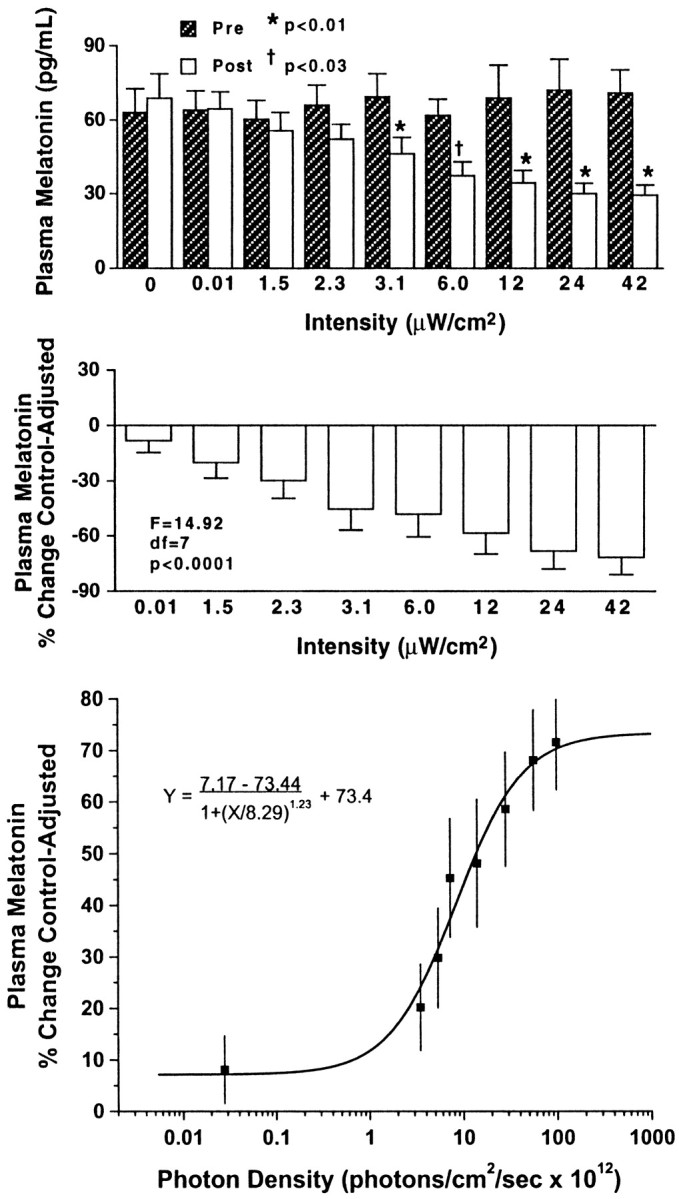
In the top two graphs, thebars represent group mean + SEM values of plasma melatonin relative to 460 nm monochromatic light exposure at different irradiances in one group of eight healthy subjects. Thetop shows plasma melatonin values before and after light exposure. There were no significant differences (F= 0.70; p = 0.69) across preexposure mean melatonin values. Light irradiances at or above 3.1 μW/cm2elicited significant melatonin suppression. The middleillustrates the subjects' plasma melatonin percent control-adjusted change scores. Progressively higher irradiance exposures at 460 nm produce progressively greater plasma melatonin percent control-adjusted change scores (p < 0.0001). Thebottom demonstrates the best-fit fluence–response curve for 460 nm exposures and percent control-adjusted melatonin suppression (R2 = 0.97). Each data point represents one group mean ± SEM.