
Fig. 6.
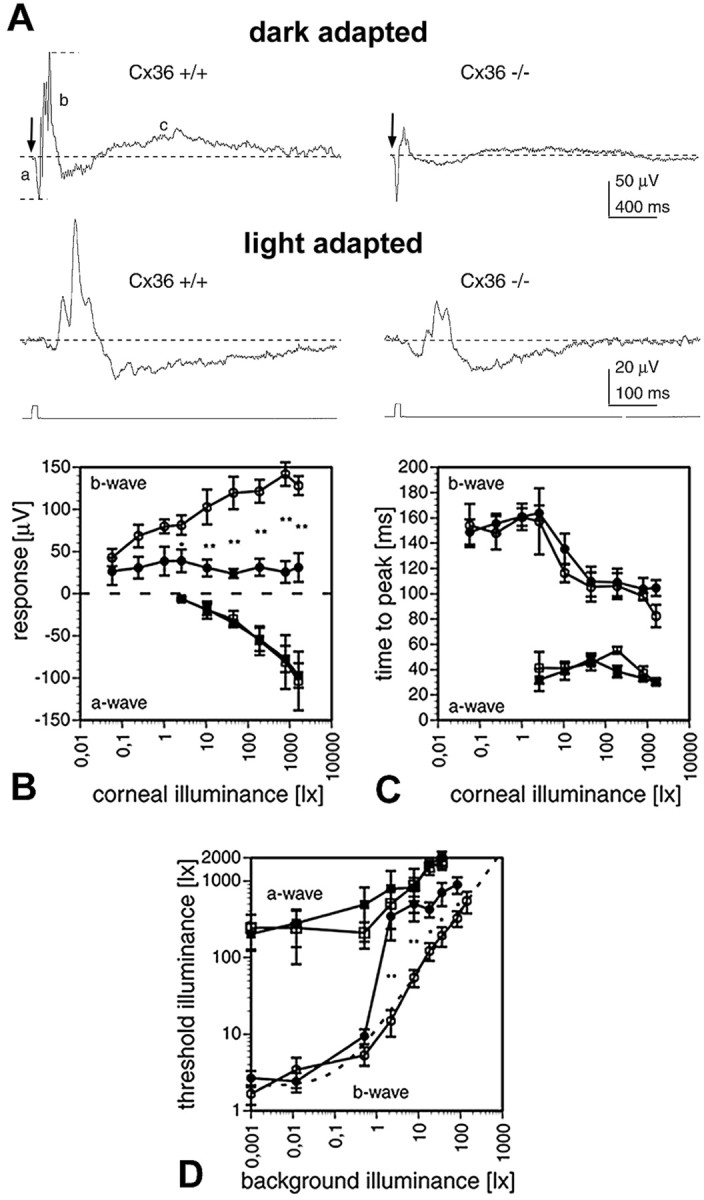
ERG recordings. A, Examples for dark- and light-adapted ERGs of Cx36 wild-type (+/+) and deficient (−/−) mice in response to 10 msec, white light flashes. Top traces, Responses to 520 lux light flashes (arrows) under dark-adapted conditions. Short dashed lines indicate how response amplitudes of a-wave (a) and b-wave (b) were measured with respect to the base level (long dashed lines). In mutant mice, the b- and c-wave amplitudes were reduced compared with wild type. The c-wave (c) was not studied in further detail. Bottom traces, Responses to 784 lux light flashes superimposed to 7.8 lux white background light. B, Intensity–response curves for the a-waves (squares) and b-waves (circles) of wild-type (open symbols) and mutant (filled symbols) mice under dark-adapted conditions. The data points plot the mean ± SEM (n = 5) in B–D. Wild-type mice showed significantly larger b-wave amplitudes for corneal illuminances in excess of 1 lux (Mann–Whitney U test; *p < 0.05; **p < 0.01).C, Time-to-peak versus intensity curves of a- and b-waves. Time-to-peak was identical for wild-type and mutant mice, for both a- and b-waves. Symbols as in B.D, Increment threshold curves for mutant (filled symbols) and wild-type (open symbols) a-waves (squares) and b-waves (circles). Each data point plots the mean ± SEM threshold illuminance for evoking a threshold response on a steady background. Mutant mice showed significantly increased b-wave thresholds for background illuminances in excess of 1 lux (Mann–Whitney U test; *p < 0.05; **p < 0.01), whereas the a-wave thresholds were not affected. The dotted line indicates a Weber–Fechner fit of the wild-type b-wave data points (ΔL/ΔLo =k(L −Lo)n;R2 = 0.99; ΔLo = 1.037 lux;Lo = 0.127; k = 10.372; n = 0.789; ΔL, incremental threshold illuminance; ΔLo, absolute threshold; L, background illuminance;Lo, “dark” light or Fechner's “Eigengrau;” k and n are constants).