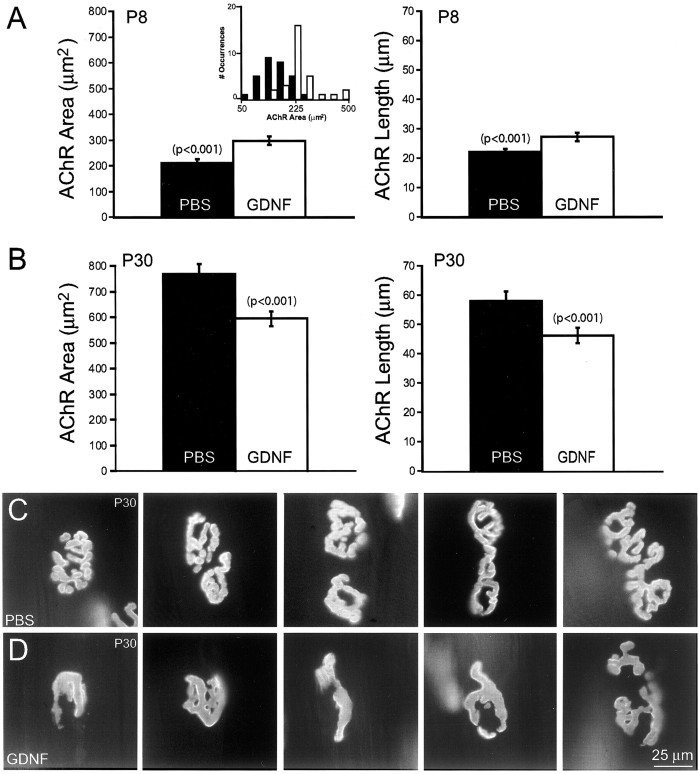
Fig. 7.
Acetylcholine receptor plaques are abnormal in GDNF-injected animals. A, Average area (left) or length (right) of acetylcholine receptor plaques at P8 after continual exposure to either GDNF (white bars) or PBS (black bars). Thesmall inset in A, left, shows the size frequency histogram of acetylcholine receptor area in P8 GDNF-exposed animals (white bars) compared with control (black bars). At P8, receptor plaques are larger (p < 0.001) and longer (p < 0.001) after GDNF injection than in control muscles. B, Average area (left) or length (right) of acetylcholine receptor plaques at P30 after continual exposure to either GDNF (white bars) or PBS (black bars). At P30, AChR plaques in GDNF-injected sternomastoid muscles are now significantly smaller than controls in area (p < 0.001) and length (p < 0.001) and are also less complex (see below). C, D, Photomicrographs of P30 receptor plaques. C, AChRs in control junctions show many small perforations and bifurcations. D, High doses (2.0 μg/gm) of GDNF decrease the complexity and size of the receptor area. One of every six junctions (n = 30) that were photographed is shown from least complex to most complex (left to right). Error bars indicate mean ± SE.

