
Fig. 5.
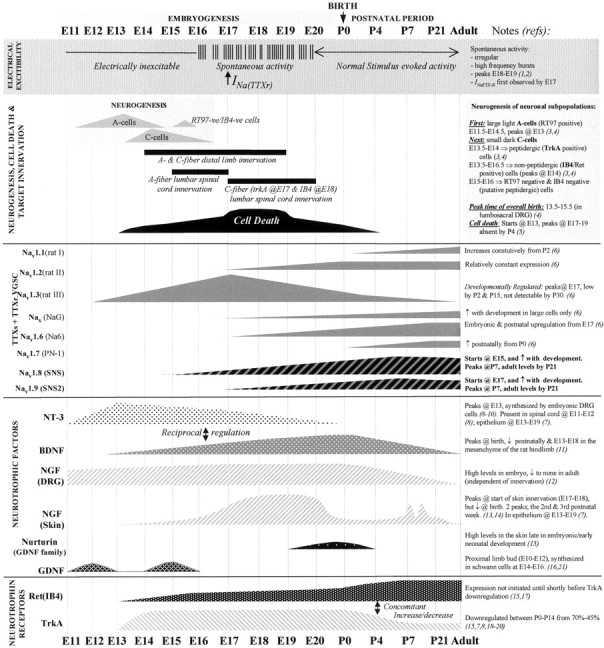
A summary of significant events defining rat DRG sensory neuron development. A schematic representation showing a time scale of developmentally regulated events of a typical DRG is illustrated from embryonic age 11 (E11) to postnatal age 21 (P21) and in adult animals (left toright of the diagram; not to scale). This is an attempt to correlate the major changes that occur in the developing DRG, with particular emphasis on acquisition of neuronal electrical excitability and changes in the expression of voltage-gated sodium channels (VGSCs). The expression of the sodium channels may be regulated by the developmental expression of specific neurotrophic factors. The top (shaded)panel illustrates the distinct patterns of electrical activity in the developing DRG, marking the period of developmentally regulated ectopic spontaneous discharge from E16 to E20, and the earliest detection of a TTX-resistant (TTXr) sodium current. The second panel outlines key developmental events, including the birth of specific neuronal subpopulations; the large light A-cell population (future A fibers) are born from E11.5 to E14.5, in advance of the birth of small, dark C-cell neurons (giving rise to C-fibers) which occurs later at E13.5–E16.5. A third unidentified subpopulation of putative nonpeptide-containing neurons (RT97-negative and IB4-negative) are generated between E14 and E15. Almost immediately after neuronal birth, the onset of axon outgrowth begins from E14 onward, followed by peripheral innervation of both A- and C-fibers simultaneously from E14 and central target innervation from E15 or E18 for A- and C-fibers, (Figure legend continues.) (Figure legend continued.) respectively. Themiddle panel shows changes in mRNA expression of known TTX-sensitive (TTXs) and the TTX-resistant (TTXr) voltage-gated sodium channels (VGSC) in the DRG, which may be correlated with developmentally regulated changes in neurotrophic factors (second panel from bottom) or changes in neuronal phenotype, which is indicated by a shift in the expression of specific neurotrophic receptors (bottom panel).Dotted lines indicate that expression at earlier ages has not yet been investigated. Arrows in the text denote an increase or decrease in expression, respectively. References are indicated by numbers on right side of figure: 1.Fitzgerald, 1987; 2.Fitzgerald and Fulton, 1992; 3. Jackman and Fitzgerald, 2000; 4.Altman and Bayer, 1984; 5.Coggeshall et al., 1994; 6.Felts et al., 1997;7. Ernfors et al., 1992; 8.Ernfors et al., 1989; 9.ElShamy and Ernfors, 1996;10.Schecterson and Bothwell, 1992; 11.Sebert and Shooter, 1993; 12.Constantinou et al., 1994.13. Davis et al., 1987; 14.Rohrer et al., 1998; 15.Molliver et al., 1997b;16.Alvares and Fitzgerald, 1999; 17.Bennett et al., 1996; 18.Phillips and Armanini, 1996;19.Farinas et al., 1998; 20.Ehrhard and Otten, 1994; 21. Wright and Snider, 1996.