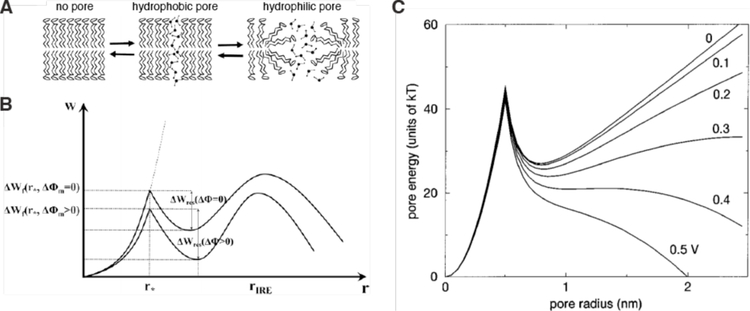
Figure 20.
Theory of pore formation in membranes by electric fields. (A) Schematic of pore formation showing the transition from a hydrophobic pore to a hydrophilic (conducting) pore. (B) Graphs of relationship between free energy of pores ΔW and pore radius r for ΔΦ m = 0 (upper curve) and at ΔΦ m > 0 (lower curve). r* is the critical radius corresponding to the transition from hydrophobic to hydrophilic pore. ΔWf corresponds to the height of the energy barrier for pore formation while ΔWres relates to the energy barrier height for pore resealing. rire is the pore radius corresponding to state of irreversible electroporation. ΔΦ m is the electrical potential difference across the membrane. Panel A and B reproduced from reference 239239. (C) Calculations of the effect of applied voltage on the energy landscape of pore formation with transmembrane potentials ranging from 0 to 0.5 V. Panel C reproduced from reference 389389.

