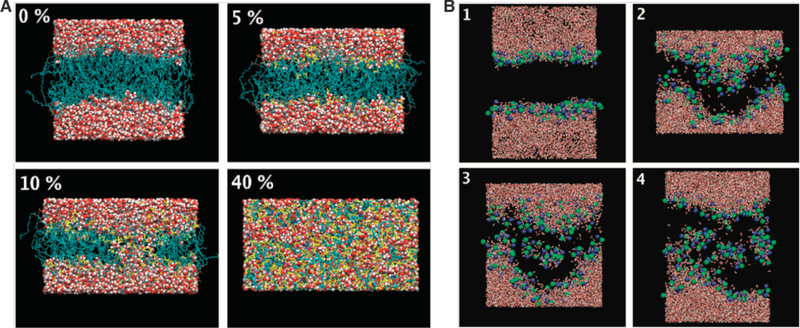
Figure 31.
Simulations of membrane bilayer perturbation with DMSO and Ethanol. (A) Presented are side views of the final structures for the bilayer systems containing 0, 5, 10, and 40 mol% of DMSO. Lipids are shown in cyan, water in red, and DMSO in yellow. Taken from reference 13231323. (B) Formation of non-bilayer structures within the membrane interior with 15 mol% of ethanol: (1) 3100 ps; (2) 13,180 ps; (3) 19,920 ps; (4) 30,000 ps. Shown are water molecules (red and white) and phosphorus (green) and nitrogen (blue) atoms of lipid head groups. The rest of the lipid atoms as well as ethanol molecules are not shown. Taken from reference 13251325.

