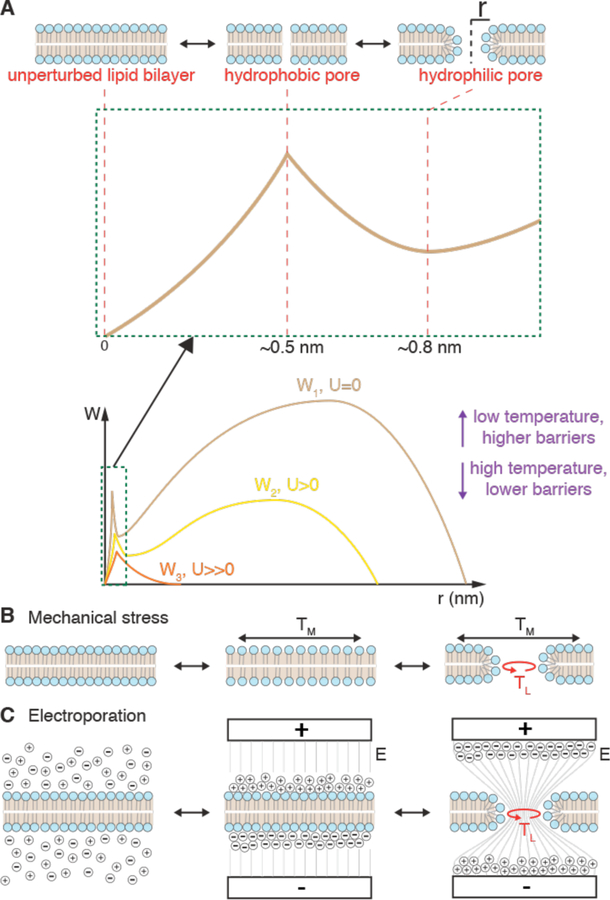
Figure 8.
Theory of mechanical and electrical disruption of lipid bilayers according to energy landscape of defect formation. (A) Energy landscape according to hydrophilic pore theory. Energy is required to open up hydrophobic defects with radius ~0.5 nm. Further growth to a hydrophilic, toroidal pore with lipid head groups facing inward is associated with a local energy minimum at pore radius ~0.8 nm. W1 represents the energy landscape at rest with no external mechanical or electrical input, W2 (yellow) represents an intermediate mechanical of electrical stress, while W3 (orange) indicates the effect of a large mechanical or electrical potential. Low temperature is synonymous with increased barrier heights while high temperature favors membrane destabilization. (B) Illustration of pore formation due to mechanical stress where the membrane is first stretched before pore formation. The applied in plane tension (TM) and the line tension (TL) within a lipid pore are diametrically opposed. (C) Illustration of pore formation due to application of electrical potential normal to membrane where E is the electric field strength and TL = line tension within a hydrophilic pore. Hydrophilic pores are conducting, thus leading to relaxation of charge buildup and a reduction of entropy in the system.

