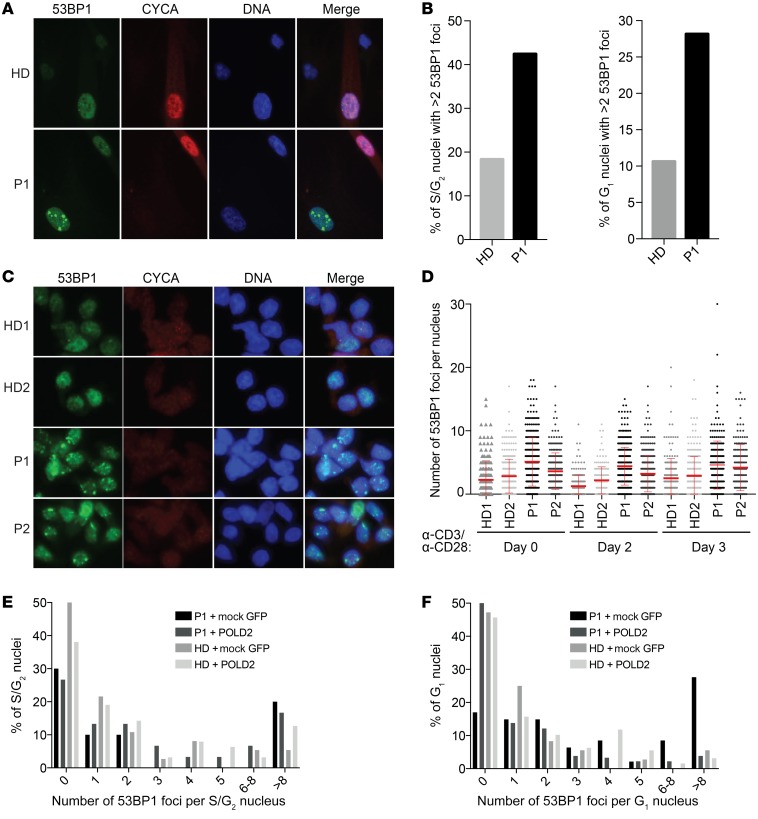
Figure 5. Polymerase δ mutation leads to 53BP1 lesions in G1 that are rescued by transduction of WT POLD2.
(A) Immunofluorescence staining of 53BP1 and CYCA in HD and P1 fibroblasts. Original magnification, ×20. (B) Quantification of 53BP1 foci in S/G2 (CYCA+) and G1 (CYCA–) nuclei. Percentage of cells with more than 2 foci per nucleus, S phase: 18.3% (HD) and 42.5% (P1); G1 phase: 10.6% (HD) and 28.2% (P1). Data are representative of 3 independent experiments. (C) Immunofluorescence staining of 53BP1 foci and CYCA in expanded T cells from HDs, P1, and P2. Original magnification, ×20. (D) Quantification of 53BP1 foci per nucleus from C, unstimulated or 48 hours or 72 hours after anti-CD3 and anti-CD28 stimulation. (E and F) Quantification of 53BP1 foci in (E) S/G2 (CYCA+) and (F) G1 (CYCA–) nuclei of HD and P1 fibroblasts upon transduction with WT POLD2 or GFP control (mock). Number of cells counted: 75 (HD plus mock), 192 (HD plus POLD2), 58 (P1 plus mock), and 213 (P1 plus POLD2). Data are representative of 2 independent experiments. Image analysis was performed using CellProfiler 2.0.

