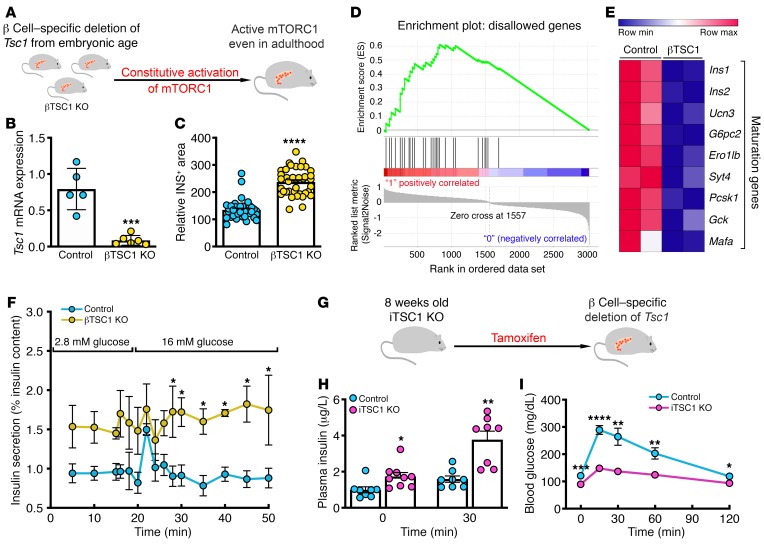
Figure 3. mTORC1 maintains the immature phenotype of pancreatic β cells.
(A) Genetic model for constitutive activation of mTORC1. (B) mRNA levels of Tsc1 in islets from control and βTSC1-KO mice (n = 7–9). ***P = 0.0002 (2-tailed unpaired t test). (C) Relative β cell areas in pancreatic sections from control and βTSC1-KO mice, measured as the ratio of insulin+ area/insulin+ cell number (n = 37–38 islets/group). ****P < 0.0001 (2-tailed unpaired t test). (D) GSEA, showing enrichment of disallowed genes in RNAseq data from βTSC1-KO islets (P < 0.05). (E) Heatmap, showing the transcriptional profile of β cell maturity markers in βTSC1-KO and control mice (P < 0.05). (F) Insulin secretion (percentage of insulin content) in a perifusion assay on βTSC1-KO and control islets exposed to 2.8 mM and 16 mM glucose (n = 4–5). *P < 0.05 (unpaired t test corrected for multiple comparisons using the Holm-Sidak method). (G) Model for inducing mTORC1 activation in adult mice. (H) Plasma insulin levels after glucose challenge in iTSC1-KO and control mice (n = 8–9). *P = 0.017, **P = 0.0012 (unpaired t test corrected for multiple comparisons using the Holm-Sidak method). (I) Intraperitoneal glucose tolerance test in iTSC1-KO and control mice (n = 10–11). *P < 0.05, **P < 0.01, ***P < 0.001, ****P < 0.0001 (unpaired t test corrected for multiple comparisons using the Holm-Sidak method).

