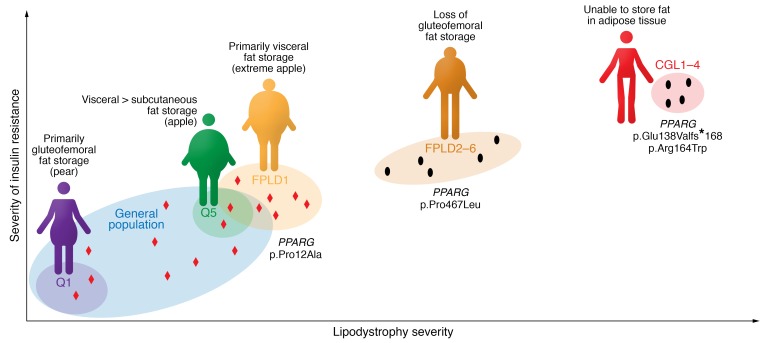
Figure 3. The severity of lipodystrophy and the degree of adipose dysfunction correlate broadly with the severity of insulin resistance.
This principle extends from the most extreme form of lipodystrophy, congenital generalized lipodystrophy (CGL), through familial partial lipodystrophies (FPLDs) to the general population. Individuals in the highest quintile (Q5) for a polygenic risk score for insulin resistance (see Lotta et al.; ref. 175) have less gluteofemoral fat, resulting in an “apple-shaped” fat distribution, whereas those in the lowest quintile (Q1) manifest a protective “pear-shaped” fat distribution and are less insulin resistant. FPLD type 1 (FPLD1) represents an intermediate state between other monogenic forms of FPLD and the highest-risk individuals from the general population. The degree of genetic disruption of adipose tissue also correlates with these phenotypes, as exemplified by the impact of a range of PPARG mutations: complete loss of PPARγ function can cause CGL; dominant-negative PPARG mutations cause FPLD3; and common PPARG variants affect insulin resistance at a population level. Exemplars of PPARG mutations in each of these categories have been included. Each black dot represents a distinct monogenic disease (see Table 1 for classifications), and red diamonds schematically represent common genetic variants that influence adipogenesis and insulin resistance.

