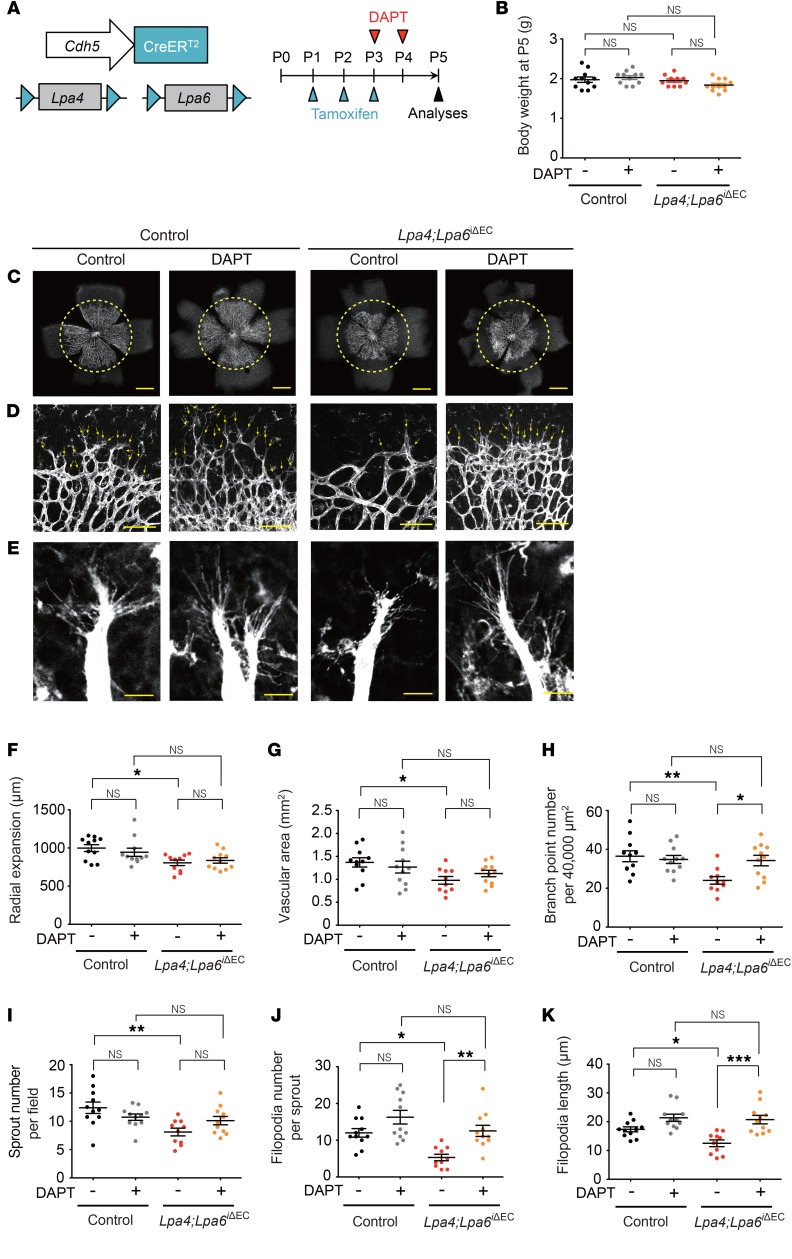
Figure 9. A Notch inhibitor ameliorates impaired retinal angiogenesis due to endothelial-specific Lpa4/Lpa6 deletion.
(A) Lpa4;Lpa6iΔEC and control littermates were injected with DAPT (50 mg/kg) at P3 and P4, and the retinas were prepared at P5. Vessels were stained with isolectin B4. (B) Body weight of DAPT-treated Lpa4;Lpa6iΔEC and control littermates at P5. (C) Representative confocal images of DAPT-treated Lpa4;Lpa6iΔEC and control retinas. Yellow dashed circles indicate the front edge of radial expansion of vehicle-treated control retina. Scale bars: 500 μm. (D) Representative confocal images of retinas at the edge of the angiogenic growth front. Sprouts are indicated by yellow arrows. Scale bars: 100 μm. (E) Representative high-magnification confocal images of retinas at the edge of the angiogenic growth front. Scale bars: 10 μm. (F–K) Quantitative analyses of retinal vessel expansion (F), vascular area (G), branch point number (H), sprout number (I), filopodia number (J), and filopodia length (K). Each dot represents the value of a mouse. Horizontal lines represent mean ± SEM (n = 10–11 mice). One retina was analyzed per mouse. *P < 0.05, **P < 0.01, ***P < 0.001, 1-way ANOVA followed by Tukey’s multiple-comparisons test.

