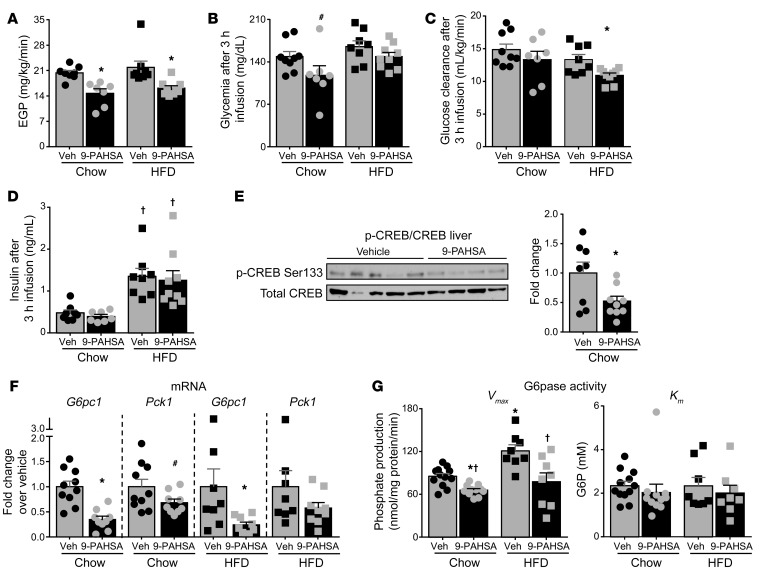
Figure 1. Acute PAHSA treatment decreases glucose production in vivo through inhibition of cAMP signaling.
Five hours after food removal, [3-3H]glucose (0.05 μCi/min) was infused through the jugular vein together with vehicle (Veh) (0.5% BSA, 3 μL/h) or 9-PAHSA (chow: 9 μg/h; HFD: 18 μg/h, preconjugated with 0.5% BSA) for 3 hours in 16-week-old mice on a chow or HFD for 11 weeks. Endogenous glucose production (EGP) (A), glycemia (B), glucose clearance (C), and insulin levels (D) at the end of infusion. n = 7–9/group. (E) Representative Western blots for total and phosphorylated CREB proteins in liver lysates from chow-fed mice at the end of infusion. n = 8–9/group. Bar graph represents fold change relative to vehicle. This Western blot is representative of 4 Western blots using the same samples. (F) Hepatic glucose-6-phosphatase catalytic unit (G6pc1) and phosphoenolpyruvate carboxykinase 1 (Pck1) mRNA expression in chow- and HFD-fed mice at the end of the infusion. G6pc1 and Pck1 mRNA are expressed as a ratio to GAPDH, which was used as the housekeeping gene. Graphs represent fold change relative to vehicle. n = 8–10/group. (A–F) *P < 0.05 versus vehicle, #P = 0.08 versus chow vehicle, †P < 0.05 versus chow diet. (G) Hepatic glucose-6-phosphatase (G6pase) activity (Vmax and Km) at the end of the infusion. n = 8–11/group. *P < 0.05 versus vehicle-treated mice on a chow diet, †P < 0.05 versus vehicle-treated HFD-fed mice. Statistical significance for all panels was evaluated by 2-way ANOVA, followed by Tukey’s post hoc test or unpaired 2-tailed Student’s t test. Data are mean ± SEM.

