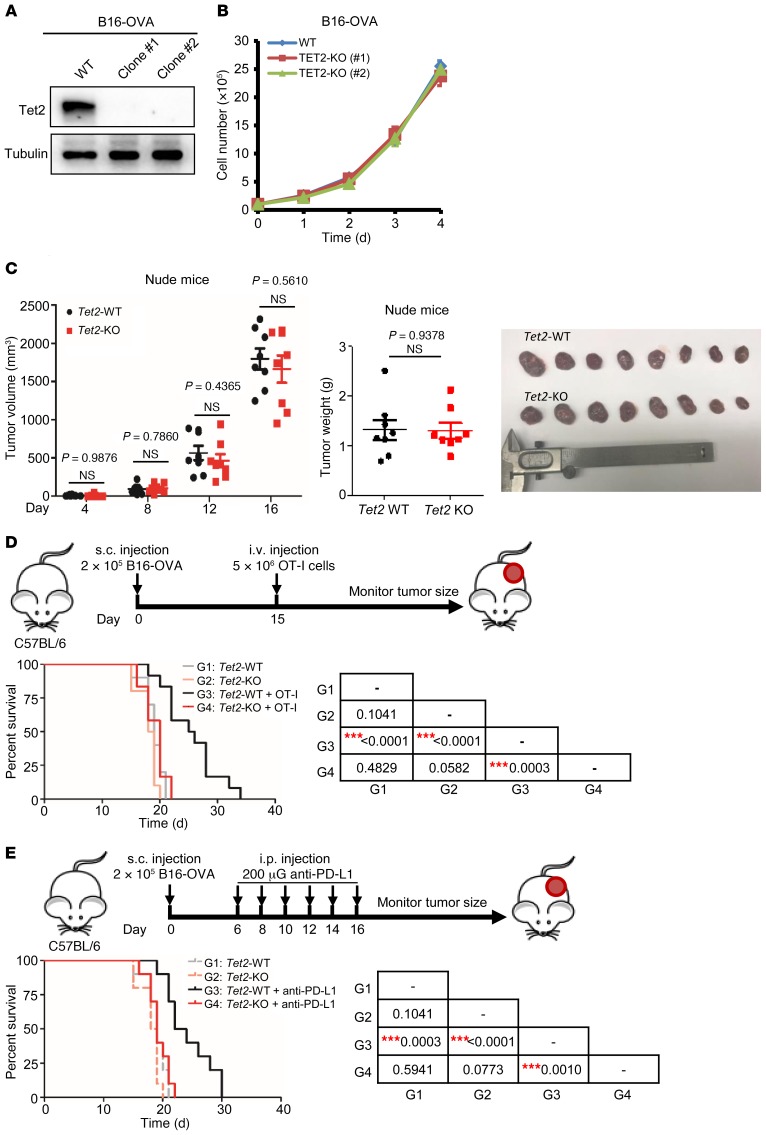
Figure 1. Loss of Tet2 confers tumor resistance to immunotherapy.
(A) Western blot confirmation of Tet2 KO in B16-OVA melanoma cells is shown. (B) Tet2-KO B16-OVA cells proliferated similarly to wild-type cells in culture. Proliferation curves for Tet2-WT and -KO B16-OVA cells were determined by seeding of the same number of cells and counting every day. Error bars represent cell numbers ± SD for triplicate experiments. (C) Tet2-KO B16-OVA cell–derived tumors grow similarly to wild-type cells in nude mice. A quantity of 2 × 10⁵ WT or Tet2-KO B16-OVA cells were injected s.c. into nude mice, and tumor volume and weight were determined and analyzed. Data represent mean ± SEM for 8 tumors. (D) Kaplan-Meier survival curves for mice injected with WT or Tet2-KO B16-OVA cells and treated with adoptive T cell immunotherapy are shown. A quantity of 2 × 10⁵ WT or Tet2-KO B16-OVA cells were injected s.c. into C57BL/6 mice at day 0 and 5 × 10⁶ OT-I cells injected i.v. at day 15. Kaplan-Meier survival curves for these mice are shown (n = 10 mice for groups without OT-I injection and n = 12 mice for groups with OT-I injection). (E) Kaplan-Meier survival curves for mice injected with WT or Tet2-KO B16-OVA cells and treated with anti–PD-L1 therapy are shown (n = 10 mice for each group). A quantity of 2 × 10⁵ WT or Tet2-KO B16-OVA cells were injected s.c., and anti–PD-L1 antibody was injected i.p., into C57BL/6 mice at the indicated time points. The survival curve of mice injected with only WT or Tet2-KO B16-OVA cells without treatment in D is also shown by the dashed gray or pink line for reference. The P values of D and E are shown in the tables at right, determined using log-rank (Mantel-Cox) test comparing each 2 groups; ***P < 0.001.

