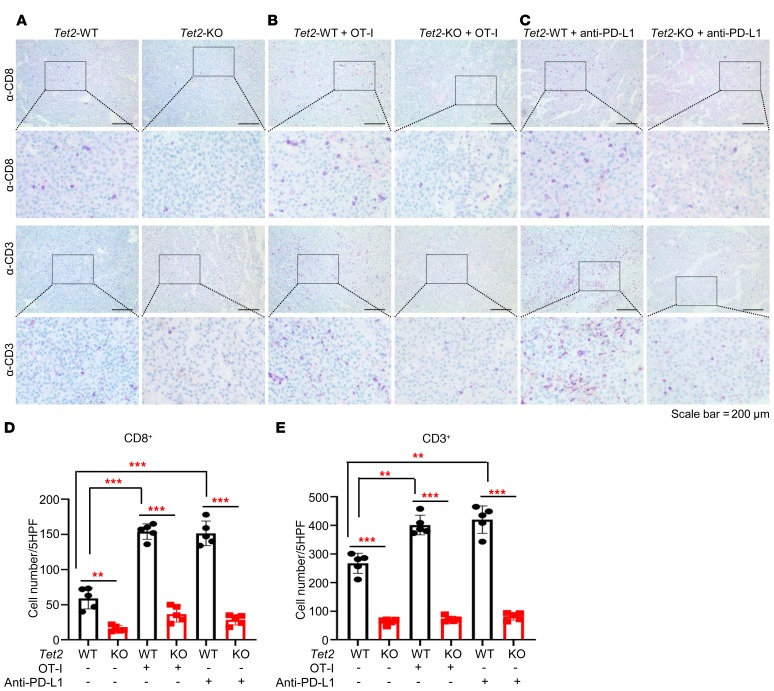
Figure 2. Loss of Tet2 reduces tumor-infiltrating lymphocytes.
(A–C) Tumor-infiltrating T cells were reduced in Tet2-KO tumors compared with WT tumors. Paraffin sections from WT or Tet2-KO B16-OVA melanomas in Figure 1, D and E, without secondary injection (A), injected with OT-I cells (B), or with anti–PD-L1 antibody (C) were subjected to IHC analysis of CD3 and CD8. Scale bars: 200 μm. (D) Quantification of CD8+ T cells from A, B, and C. Average cell number per high-power field (HPF) is shown; 5 HPFs were calculated per group. Bonferroni-adjusted **P < 0.01, ***P < 0.001, with raw P value derived from unpaired Student’s t test. Error bars represent ± SD. (E) Quantification of CD3+ T cells from A, B, and C. Average cell number per HPF is shown; 5 HPFs were calculated per group. Bonferroni-adjusted **P < 0.01, ***P < 0.001, with raw P value derived from unpaired Student’s t test. Error bars represent ± SD.

