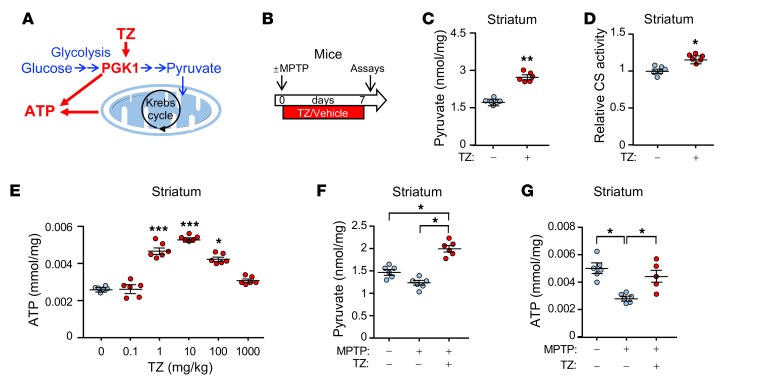
Figure 1. TZ enhances glycolysis in the mouse brain.
Data points represent individual mice. Blue indicates controls and red indicates TZ treatment. (A) Schematic of ATP production by glycolysis and oxidative phosphorylation. (B) Schematic time course for experiments in C–G. Eight-week-old C57bl/6 mice were given MPTP (20 mg/kg i.p.) or vehicle 4 times at 2-hour intervals. Then, TZ (10 μg/kg) or vehicle was injected i.p. once a day for 1 week. Assays were performed on day 7. (C–E) Pyruvate levels (C), citrate synthase (CS) activity (D), and ATP levels (E) were measured in mouse striatum. TZ doses are indicated in E. n = 6. Statistical comparison was made versus no TZ treatment. (F and G) Pyruvate (F) and ATP (G) levels in the mouse striatal region. Supplemental Table 3 shows statistical tests and P values for all comparisons. Bars and whiskers indicate the mean ± SEM. *P < 0.05, **P < 0.01, and ***P < 0.001, by Mann-Whitney U test (C and D), Kruskal-Wallis with Dunn’s test (E), and Kruskal-Wallis with Dwass-Steele-Critchlow-Fligner test (F and G).

