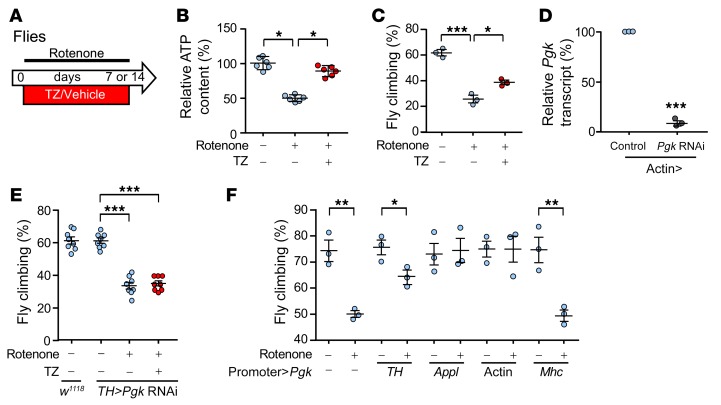
Figure 4. TZ enhances Pgk activity to attenuate rotenone-impaired motor performance.
(A) Schematic for experiments in panels B–F. Flies received rotenone (125 or 250 μM in food) with TZ (1 μM) or vehicle for 7 or 14 days. (B) Relative ATP content in the brains of w1118 flies that received 250 μM rotenone with or without TZ for 14 days. n = 6, with 200 fly heads for each treatment in each trial. (C) Climbing behavior of flies after 250 μM rotenone with TZ (1 μM) or vehicle for 7 days. Data show the percentage of flies that climbed up a tube (see Methods). n = 3, with 200 flies tested for each treatment in each trial. (D) Knockdown of Pgk in offspring of actin-Gal4 crossed with UAS-Pgk RNAi flies. Offspring of actin-Gal4 crossed with y1 v1 P [CaryP] attP2 were used as a genetic background matched control. n = 3, with RNA collected from 30 fly heads for each sample. (E) Pgk was knocked down in TH neurons by crossing UAS-Pgk RNAi flies with flies carrying the TH neuron-specific promoter (TH-Gal4) to produce TH>Pgk RNAi flies. Rotenone (250 μM) and TZ were administered as indicated for 7 days. Climbing behavior was measured on day 7. n = 8, with 200 flies tested for each treatment in each trial. (F) Pgk (UAS-Pgk) overexpression was driven by a dopaminergic neuron promoter (TH-Gal4), a pan-neuronal promoter (Appl-Gal4), a pan-cell promoter (Actin-Gal4), and a muscle-specific promoter (Mhc-Gal4). Rotenone (250 μM) was administered for 7 days, and climbing behavior was measured on day 7. n = 3, with 200 flies tested for each treatment in each trial. Data points represent individual groups of flies, and bars and whiskers show the mean ± SEM. Blue indicates controls and red indicates TZ treatment. Supplemental Table 3 shows statistical tests and P values for all comparisons. *P < 0.05, **P < 0.01, and ***P < 0.001, by Kruskal-Wallis with a Dwass-Steele-Critchlow-Fligner test (B), 1-way ANOVA with Tukey’s test (C and E), paired t test (D), and unpaired t test (F).

