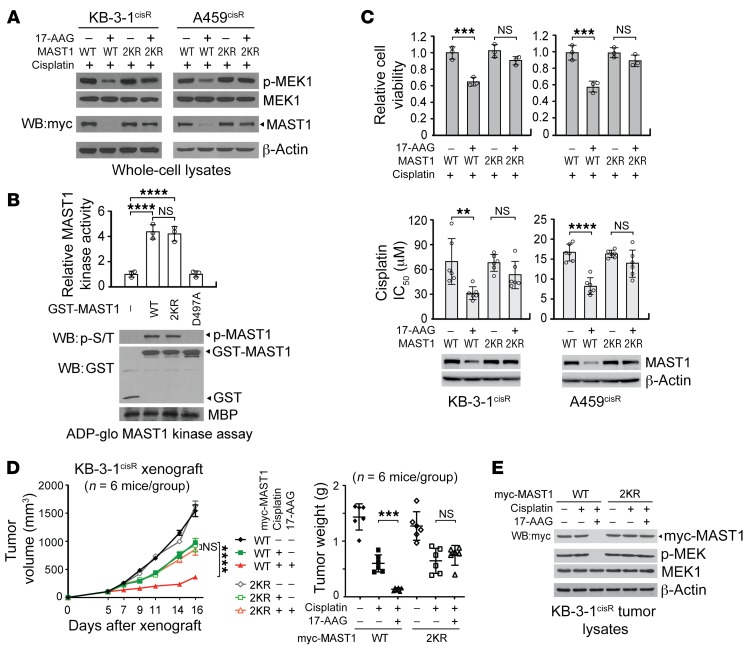
Figure 4. Ubiquitination of MAST1 at K317 and K545 induces MAST1 degradation and cisplatin-mediated cell death upon 17-AAG treatment.
(A) Effect of 17-AAG on MAST1 WT and K317R/K545R (2KR) degradation. Cells were treated with or without 17-AAG (200 nM) and sublethal doses of cisplatin as in Figure 2E. MAST1 expression and MEK1 activation was assessed by immunoblotting. (B) MAST1 in vitro kinase assay of MAST1 WT and 2KR. Kinase activity of GST-MAST1 variants. Kinase dead mutant D497A MAST1 was used as a negative control. (C) Cell viability and cisplatin sensitivity of cisplatin-resistant cells expressing MAST1 WT or 2KR. Cell viability was determined by trypan blue exclusion in cells treated with 200 nM of 17-AAG and sublethal doses of cisplatin for 48 hours. Cisplatin sensitivity is shown as cisplatin IC50, which was determined by CellTiter-Glo assay. (D) Effect of 17-AAG and cisplatin treatment on tumor volume and tumor weight of xenograft mice bearing KB-3-1cisR with MAST1 WT or 2KR overexpression. Mice were treated with cisplatin (5 mg/kg) and 17-AAG (50 mg/kg) from 5 days after xenograft. (E) MAST1 expression and MEK1 activation levels in tumor lysates. WT or 2KR MAST1 was overexpressed in MAST1 knockdown cells for functional assays. Data are mean ± SD from 3 technical replicates for B and C; n = 6 for D. Error bars represent SEM for tumor volume and SD for tumor weight. Data shown are representative of 3 (A and C [top]) and 2 (B–E) independent biological experiments. Data are mean ± SD from 3 technical replicates for B and C; n = 6 for D. Error bars represent SEM for tumor volume and SD for tumor weight. Statistical analysis was performed by 2-way ANOVA for D (left) and 1-way ANOVA for all the rest. **P < 0.01; ***P < 0.005; ****P < 0.0001.

