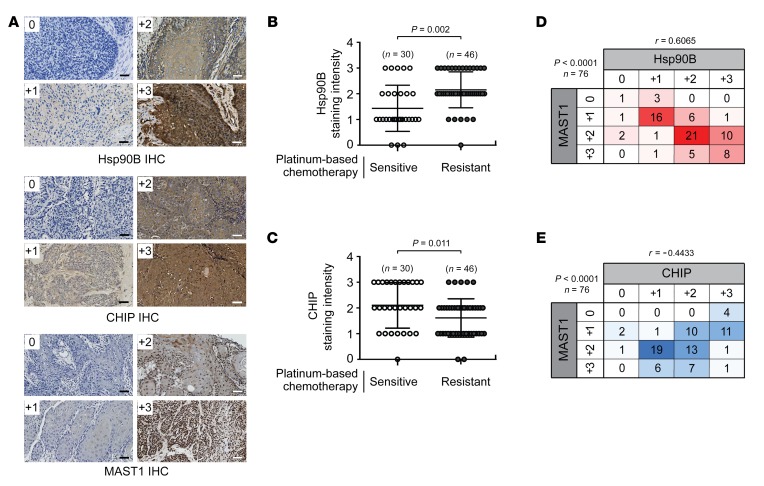
Figure 7. Hsp90B-MAST1-CHIP signaling correlates with cisplatin resistance in human head and neck cancer.
(A) Tumor samples from HNSCC patients who received platinum-based chemotherapy. Representative IHC staining images of hsp90B, CHIP, and MAST1 for 0, +1, +2, and +3 scores are shown. Scale bars = 50 μm. The levels of hsp90B (B) and CHIP (C) were monitored by IHC in tumors from HNSCC patients who were sensitive or resistant to platinum-based (cisplatin or carboplatin) chemotherapy. The correlation matrix heatmaps between MAST1 and hsp90B (D) or CHIP (E) in HNSCC patients who received platinum-based chemotherapy. r represents Pearson’s correlation coefficient. For B and C, n = 30 (open circles; platinum-sensitive group) and n = 46 (closed gray circles; platinum-resistant group); for D and E, n = 76. P values were determined by 2-tailed Student’s t test for B and C, and χ2 test for D and E.

