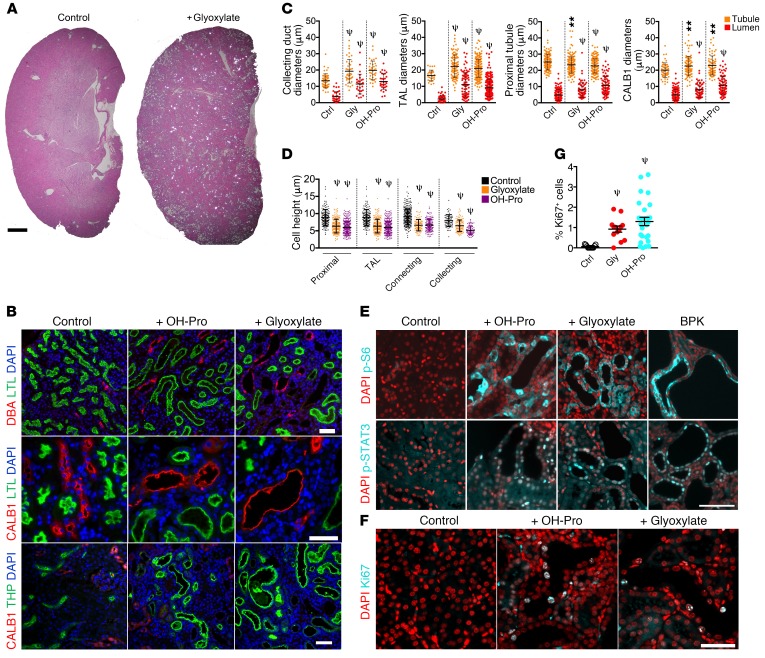
Figure 1. Chronic CaOx crystal deposition leads to tubule dilation and activation of PKD-associated signaling pathways.
(A) H&E-stained sections of kidneys from glyoxylate-treated NPT2a–/– mice imaged by polarizing light microscopy. CaOx crystals appear as bright spots. Scale bar = 1 mm. (B) Kidney sections from NPT2a–/– mice treated with glyoxylate or hydroxyproline were stained with LTL, DBA, CALB1, and THP. (C) Quantification of tubule and lumen diameters from animals in B. (D) Quantification of cell heights from animals in B. TAL, thick ascending limb of Henle. (E) Immunofluorescence microscopy to detect mTOR activity: p-S6 (Ser235/236) and p-STAT3 (Tyr705). A BPK mouse was used as a positive control. (F) Immunostaining for the cell-cycle marker Ki67. (G) Quantification of Ki67+ cells as a percentage of the total number of DAPI-stained nuclei per field analyzed. Control n = 3, n = 3 for glyoxylate, and n = 2 for hydroxyproline. **P < 0.01 and ψP < 0.0001, by Mann-Whitney U test. Error bars represent the SD. Scale bars: 50 μm. Ctrl, control; Gly, glyoxylate; OH-Pro, hydroxyproline.

