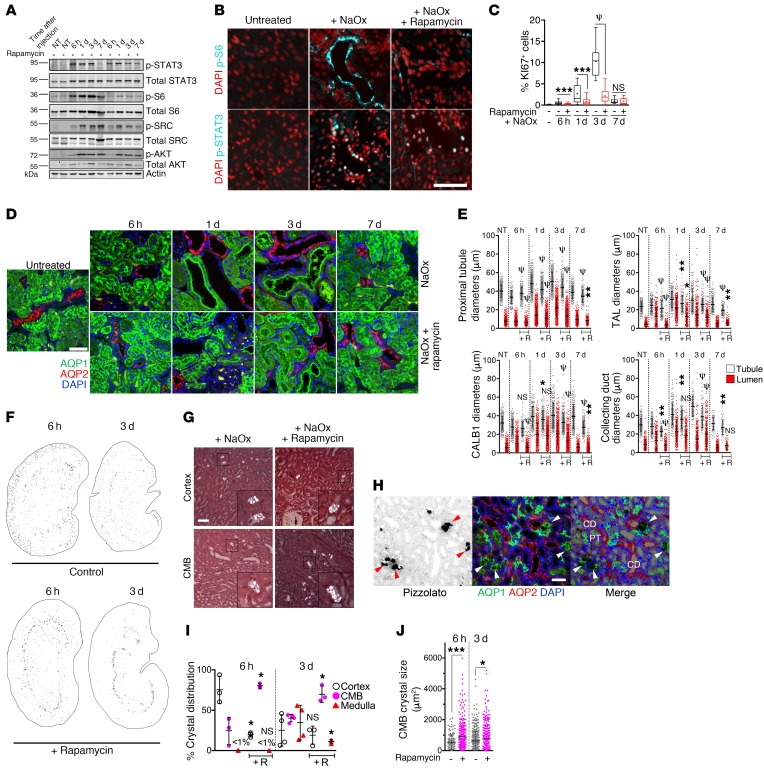
Figure 4. mTOR inhibition blunts tubule dilation and hypertrophy after NaOx challenge and disrupts efficient CaOx crystal excretion.
(A) Immunoblots of kidney lysates. (B) Immunostaining 6 hours after treatment with NaOx, with or without rapamycin pretreatment. (C) Quantification of Ki67+ cells as a percentage of total cells. (D) Images showing immunostaining for the segment-specific markers AQP1 and AQP2. (E) Quantification of tubular and lumen diameters with rapamycin (+R). (F) Inverted polarized light micrographs of whole kidneys 6 hours or 3 days after NaOx treatment. (G) High-magnification polarized light micrographs showing oxalate crystals in renal cortex and the CMB 6 hours following NaOx treatment, with or without rapamycin pretreatment. (H) Pizzolato staining together with segment-specific markers in rapamycin-treated rats. Arrowheads point to crystals. CD, collecting duct; PT, proximal tubule. (I) Quantification of intrarenal location of deposited CaOx crystals 6 hours and 3 days after NaOx treatment, with and without rapamycin. (J) Quantification of the size distribution of CaOx crystals and aggregates in rats treated with NaOx, with or without rapamycin. NaOx-treated animals after 6 hours (n = 5), 1 day (n = 5), 3 days (n = 5), and 7 days (n = 3). NaOx- plus rapamycin-treated animals after 6 hours (n = 5), 1 day (n = 5), 3 days (n = 5), and 7 days (n = 2). Scale bars: 50 μm. Original magnification, ×3 (insets in G). Error bars represent the SD. All data are representative of 3 experiments for NaOx-treated animals. Box-and-whisker plots represent 90% of the values, with the median displayed as a line in between the second and third quartiles and the mean with intersecting bars. *P < 0.05, **P < 0.01, ***P < 0.001, and ψP < 0.0001, by Mann-Whitney U test.

