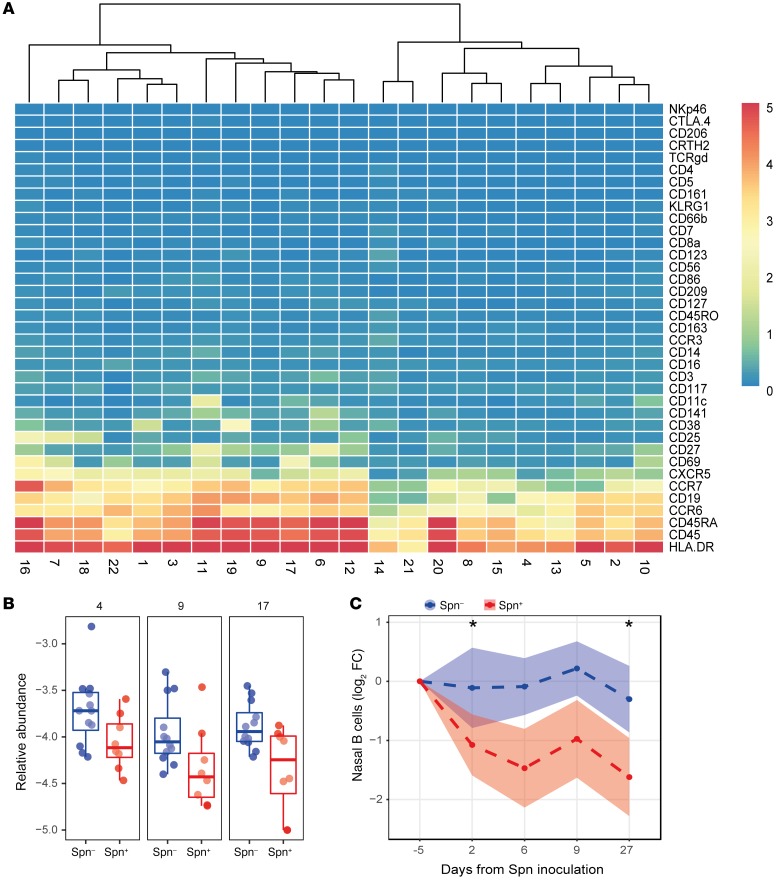
Figure 3. Nasal B cells are depleted following pneumococcal carriage.
(A) Heatmap showing the expression of 37 markers for all B cell clusters. Clusters were ordered based on similarity, and a distance dendrogram is depicted. (B) The relative abundance for each of the 3 significantly higher clusters normalized to stromal cells is expressed on a log10 scale for carriage– (Spn–, blue, n = 12) and carriage+ (Spn+, red, n = 8) subjects. Box plots, depicting median and interquartile ranges, with whiskers extending to 1.5× interquartile range or maximum value, and individual subjects are shown. (C) Levels of CD19+ nasal B cells longitudinally measured by flow cytometry from minimally invasive nasal curettes in an independent cohort for carriage– (Spn–, blue, n = 52) and carriage+ (Spn+, red, n = 42) subjects. Mean and standard error of the mean of log2-transformed fold-change levels relative to baseline are shown. *P < 0.05 by Wilcoxon’s test compared with baseline with Bonferroni’s correction for comparing multiple time points.

