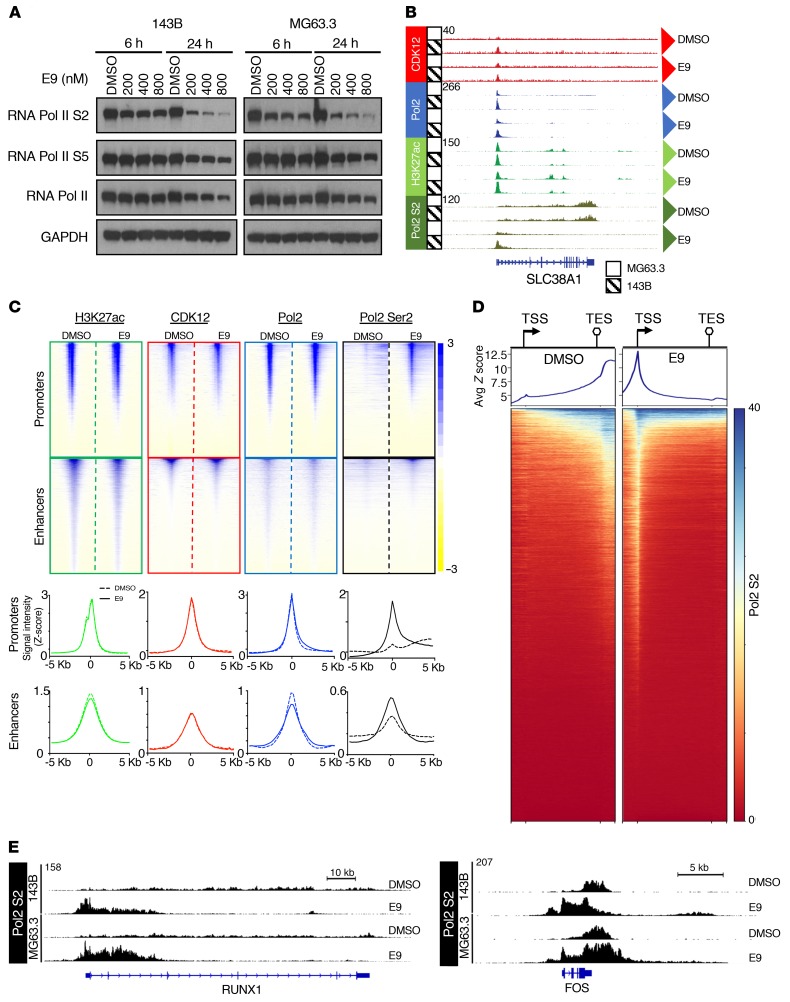
Figure 4. E9 treatment impairs transcription elongation in OS cells.
(A) Western blot analysis of the indicated proteins in 143B and MG63.3 cells treated with DMSO or increasing concentrations of E9 at 6 and 24 hours. GAPDH, loading control. (B) Representative browser views of ChIP-Seq data at the SLC38A1 locus. (C) Windowed heatmaps showing H3K27ac, CDK12, RNA Pol2, and RNA Pol2 Ser2 ChIP-Seq signals ± 5 kb from the TSS in 143B cell line. Below are aggregate plots showing the respective ChIP-Seq signals for the heatmaps depicted above. (D) Metagene analysis of Ser2 ChIP-Seq signal across all genes sorted in descending order based on the average signal per binned region. Windows include 1 kb upstream of the TSS and 1 kb downstream of the TES. (E) Browser views of Ser2 ChIP-Seq signal at RUNX1 and FOS loci in DMSO- and E9-treated OS cells.

