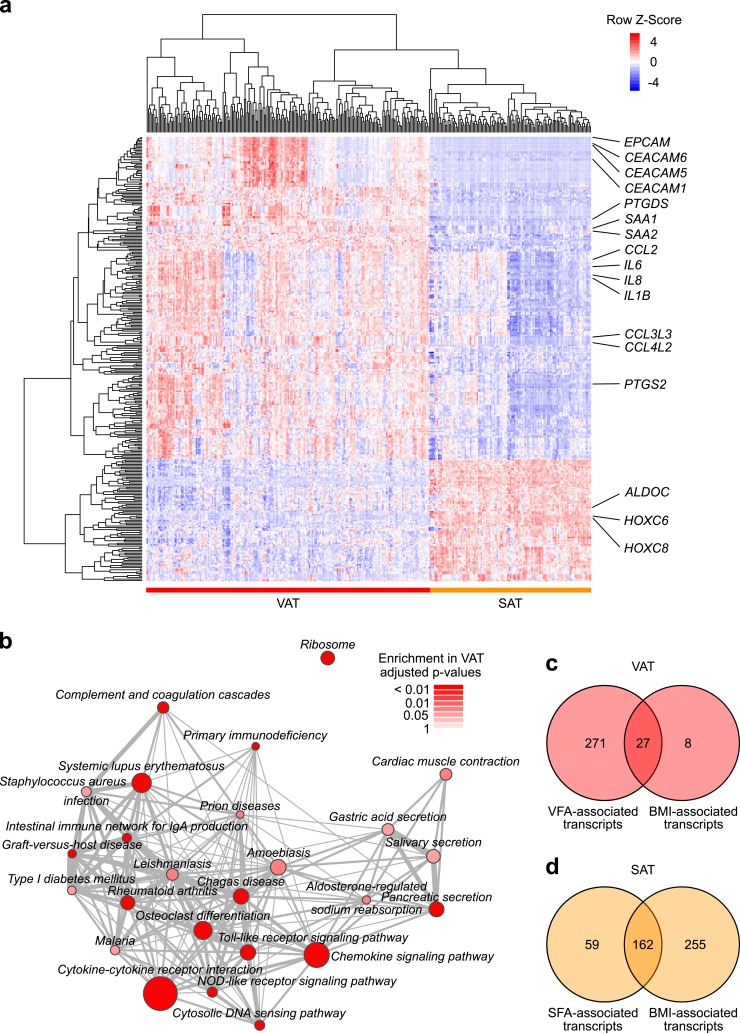
Figure 1.
Transcriptomic differences between VAT and SAT. (a) Heat map of differential gene expression between VAT and SAT. Genes with an adjusted P value <0.05 and relative fold change >0.5 and < -0.5 are displayed. (b) GSEA results of gene sets (KEGG gene set collection) significantly differentially enriched between VAT and SAT. Nodes are sized in relationship to gene set size. Edges denote overlap between gene sets. Analyses were adjusted for multiple testing. (c) VAT transcripts significantly associated with VFA and BMI. (d) SAT transcripts significantly associated with SFA and BMI.

