. 2019 Sep 20;8:e50530. doi: 10.7554/eLife.50530

Figure 6. Base-pairing with target mRNA dictates the use of miR-16 in HSUR2-mediated mRNA repression.

(A) U937 cells stably expressing the Firefly luciferase gene with partial PACS1 3′UTR (Figure 2a) were transiently co-transfected with a plasmid carrying GFP and either HSUR2 promoter alone (ΔHSUR2) or wild-type HSUR2 (HSUR2) and a control LNA inhibitor, or an LNA inhibitor with complementarity to miR-142–3p or miR-16. (B–D) Same as in (A) but with cells stably expressing the Firefly luciferase gene with partial TP53RK 3′UTR (B), mutant PACS1 (altbsPACS1mut) 3′UTR (C), or mutant TP53RK (altbsTP53RKmut) 3′UTR (D). Modified residues are shown in blue. Dots represent mean values of independent experiments (n = 3) with error bars representing s.d. Two-sided one-sample Student’s t-test vs. control (ΔHSUR2) set at 1.0. *p<0.05, **p<0.01.

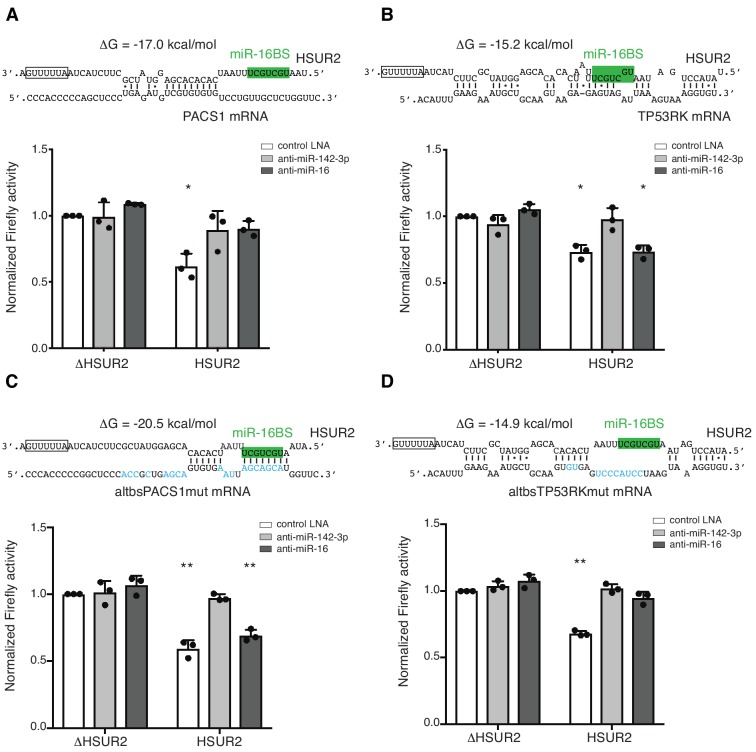
Figure 6—source data 1. Source data for Figure 6.
DOI: 10.7554/eLife.50530.022

Figure 6.

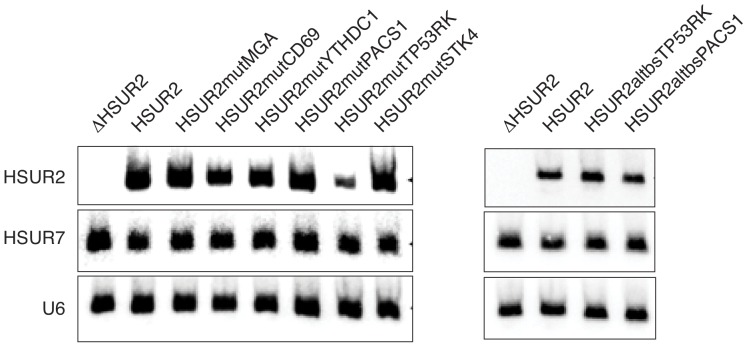
Figure 6—figure supplement 1. Expression of mutant versions of HSUR2 used in this study.

Figure 6—figure supplement 1.

Northern blot analysis of total RNA isolated from HEK293T/17 cells transiently co-transfected with a plasmid expressing HSUR7 (transfection control) and a plasmid carrying GFP and either HSUR2 promoter alone (ΔHSUR2), wild-type HSUR2 (HSUR2), or the indicated mutant version of HSUR2. U6 snRNA provides a loading control.
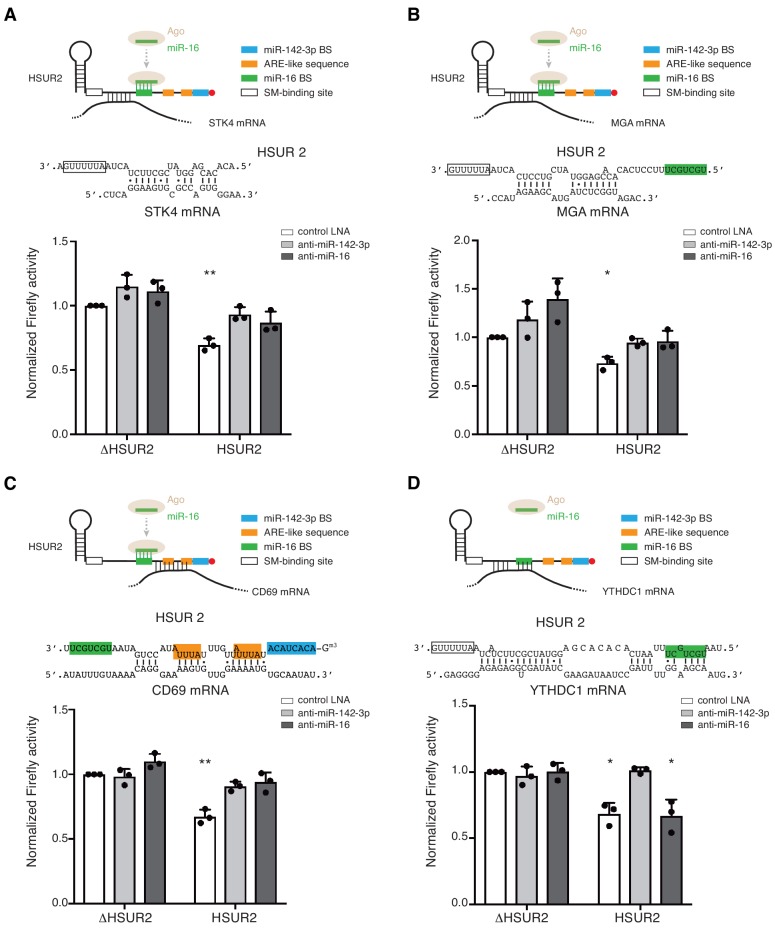
Figure 6—figure supplement 2. Base-pairing with target mRNA determines the use of miR-16 in HSUR2-mediated mRNA repression.

Figure 6—figure supplement 2.

(A–D) Same as in Figure 6 for HSUR2 binding sites in STK4 (A), MGA (B), CD69 (C), and YTHDC1 (D) partial 3′UTRs. Dots represent mean values of independent experiments (n = 3) with error bars representing s.d. Two-sided one-sample Student's t-test vs. control (ΔHSUR2 + control LNA) set at 1.0. *p<0.05, **p<0.01.
Figure 6—figure supplement 2—source data 1. Source data for Figure 6—figure supplement 2.
DOI: 10.7554/eLife.50530.020