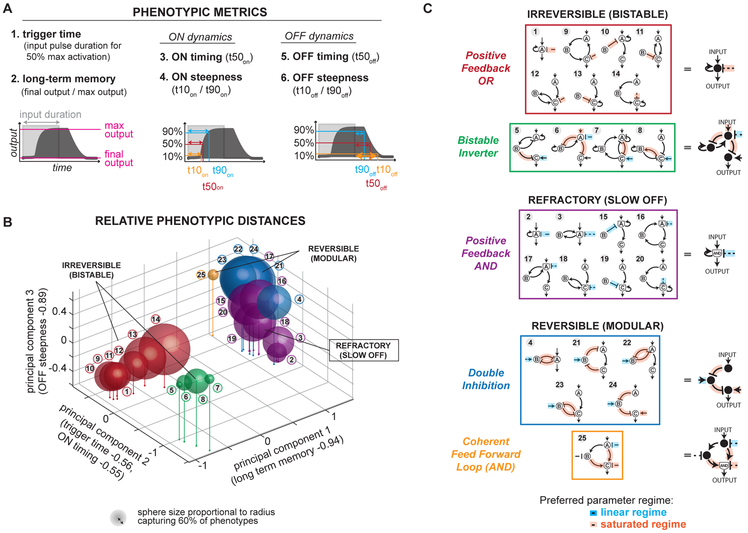
Figure 2. Minimal kinetic filters of 1, 2, and 3 nodes phenotypically cluster into five groups.
(A) Metrics used to cluster minimal kinetic filters by phenotypic features. For metrics 2-5, a single input pulse of duration 50,000s was applied. Measurements of ON dynamics are relative to input ON time, and measurements of OFF dynamics are relative to input OFF time. OFF dynamics were not measured for circuits where max output = final output. Phenotypic metrics were measured for all parameter sets of minimal kinetic filters with temporal ultrasensitivity ≥ 0.5 and trigger time ≥ 1s (total of 2,896 parameter sets distributed across 25 topologies in Figure 1D). (B) Location of minimal kinetic filters in 3D space of first 3 principal components of 6 phenotypic metrics. See Figure S3 for singular values and composition of each principal component. Each sphere is centered at the mean principal component value observed over all kinetic filtering parameter sets of each minimal kinetic filtering architecture. Sphere size is proportional to radius capturing 60% of observed phenotypes. (C) Minimal kinetic filters cluster into 5 phenotypic groups that each share structural features. Archetypal topologies (right column) are the simplest topology in each phenotypic group. Circuit links where kinetic filtering requires Michaelis-Menten kinetics to be in the linear or saturated regime are indicated in blue and orange respectively.

