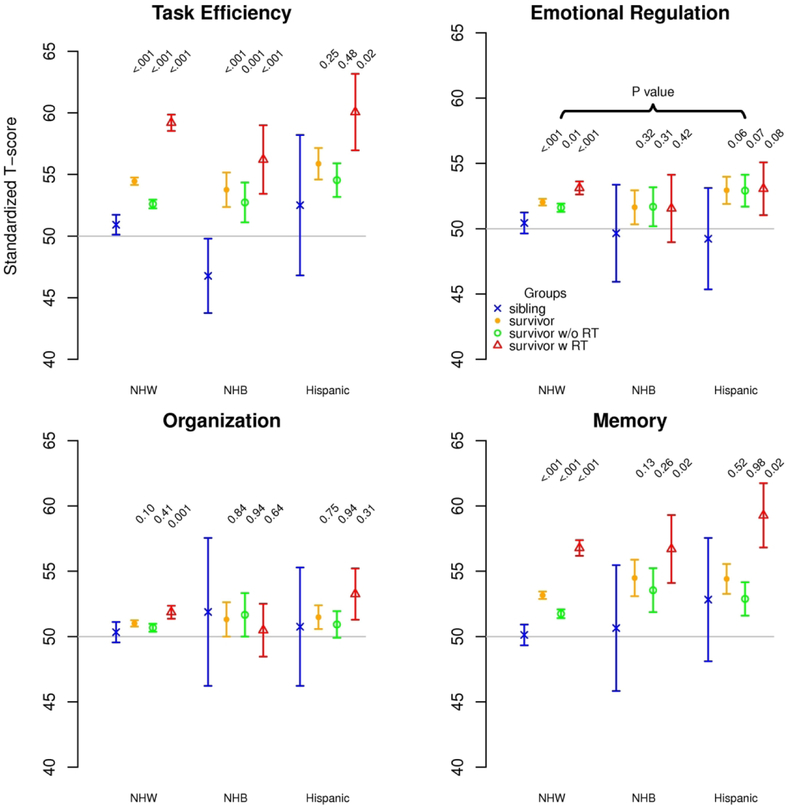
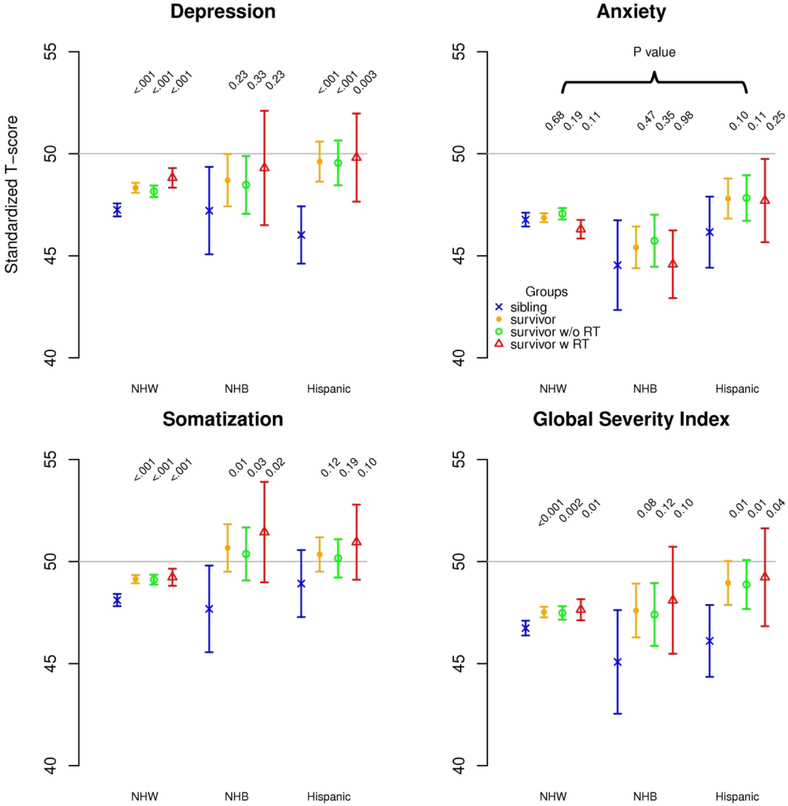
Figure 2.
(A) Neurocognitive outcomes of survivors and siblings within each racial/ethnic group as standardized T-scores, sibling mean=50 SD=10. (B) Emotional (BSI-18) outcomes of survivors and siblings within each racial/ethnic group as standardized T-scores, general population mean=50 SD=10. For both outcomes, higher scores indicate worse function; P-values compare each survivor group to same race/ethnicity sibling group adjusted for sex, age at follow-up, year at diagnosis, methotrexate exposure (intravenous and intrathecal), corticosteroid exposure and any CTCAE grade 3-4 chronic medical condition. NHW=non-Hispanic white, NHB=non-Hispanic black, RT=cranial radiation therapy


