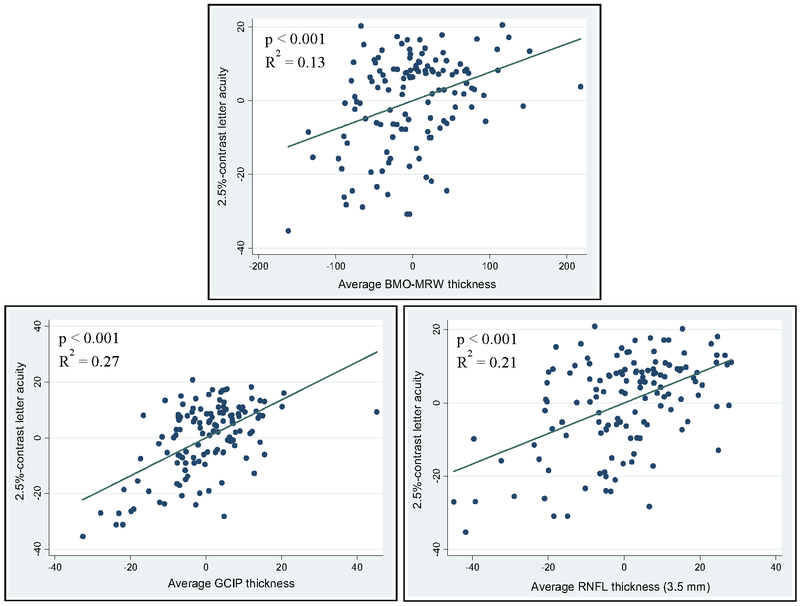
Fig. 2.
Adjusted variable plots comparing the strength of significant associations between OCT-derived average Bruch’s membrane opening minimum rim width (BMO-MRW; upper panel), average ganglion cell + inner plexiform layer (GCIP; lower left panel), and peri-papillary retinal nerve fiber layer (pRNFL; lower right panel) thicknesses and 2.5%-contrast letter acuity in MS, accounting for age, sex, disease duration, and history of optic neuritis. Consistent with a tighter distribution fit along the linear regression line, GCIP thickness exhibits the highest R2-value. p-values and R2-values were derived from mixed-effect linear regression models, adjusting for within-subject inter-eye correlation, and accounting for age, sex, disease duration, and history of optic neuritis

