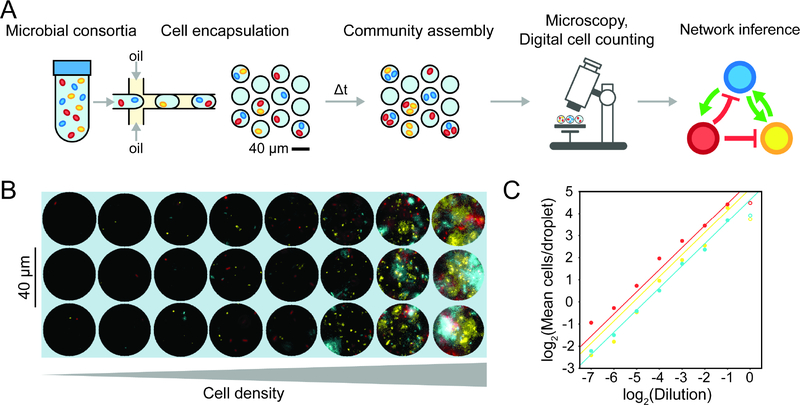
Figure 1. Overview and characterization of microbial interaction network inference in microdroplets (MINI-Drop).
(a) Overview schematic of the MINI-Drop method. A mixed microbial culture and oil are loaded into a droplet-forming microfluidic device. Cells are randomly encapsulated into droplets based on a Poisson distribution. The droplets are incubated for a period of time to allow cell growth and division and then imaged using fluorescent microscopy. A computer vision workflow rapidly identifies droplets and determines the number of each fluorescently labeled strain within each droplet (Fig. S1). A microbial interaction network is inferred based on the difference in the mean number of cells in the absence and presence of a partner strain. (b) Representative fluorescent microscopy images of droplets containing three bacterial strains labeled with YFP (ST Lac*), RFP (EC WT) or CFP (EC Met-) (see Tables S9–10). (c) Scatter plot of the dilution factor of the mixed culture vs. the log2 transform of the mean number of cells per drop (cell count distribution shown in Fig. S2a and analysis of mean fluorescence in Fig. S2b). Each data point represents the mean of 400–600 droplets and lines denote linear regression fits to the data excluding the highest dilution factor (indicated by empty circles to emphasize divergence from the linear trend). Red, yellow and blue data points correspond to EC WT, ST Lac* and EC Met-, respectively.

