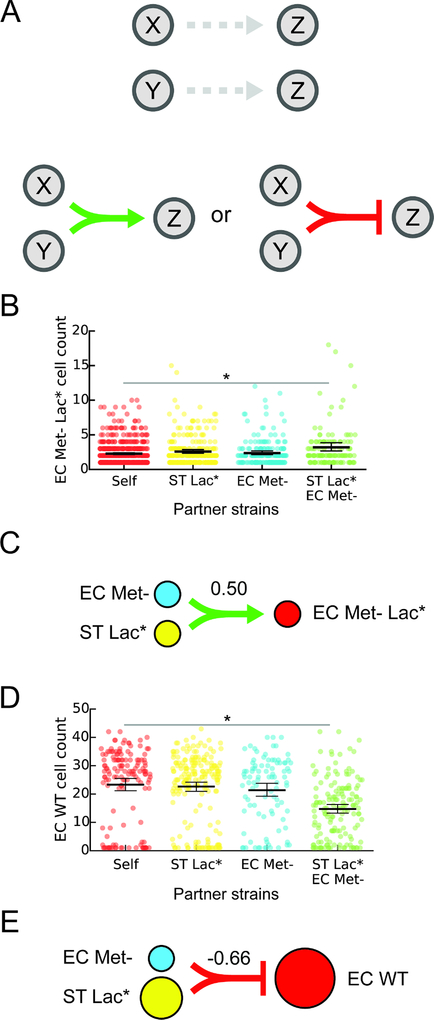
Figure 4. Investigating higher-order interactions using MINI-Drop.
(a) Schematic showing an example of a higher-order interaction. Droplets containing two strains X and Z or Y and Z do not exhibit interactions. In three-member droplets, a negative or positive interaction from X and Y to Z is present and is defined as a higher-order interaction. (b) Categorical scatter plots of the number of EC Met- Lac* cells in droplets containing the single strain EC Met- Lac* (self), pairs of strains including EC Met- Lac* and EC Met- or ST Lac* or all three strains (EC Met- Lac*, EC Met- and ST Lac*). Black horizontal bars denote the mean number of cells per droplet and error bars represent the bootstrapped 95% confidence interval for the mean. The horizontal bar (gray) represents a statistically significant difference in means based on the Mann-Whitney U test (p = 1.2e–3, n = 703, Table S3). (c) Schematic showing the higher-order inferred network for the data shown in panel (b). The line width represents the inferred strength of the higher-order interaction. Node size is proportional to the average cell count of each strain grown in isolation. (d) Categorical scatter plots of the number of EC WT cells in droplets containing the single strain EC WT, two strains including EC WT and ST Lac* or EC Met- or all three strains (EC WT, ST Lac* and EC Met-) in lactose minimal media. The horizontal bar (gray) represents a statistically significant difference in means based on the Mann-Whitney U test (p = 2.9e–10, n = 296, Table S3). (e) Schematic showing a higher-order interaction inferred using the data shown in (d). The line width represents the strength of the inferred higher-order interaction. Node size is proportional to the average cell count of each strain grown in isolation.

