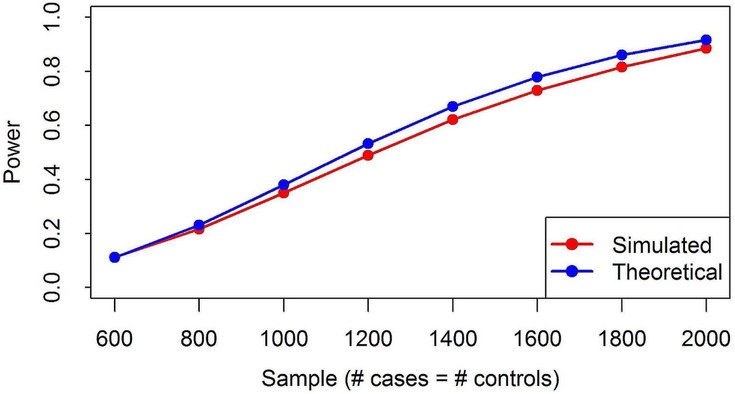
Figure 5. Power comparison between theoretical and simulation studies.
Figure shows the comparison of theoretical power computed based on PAMAM and the power from simulation. X-axis shows the total sample size with equal cases and controls. Power is computed for the ancestral odds ratio = 1.636, admixture proportion = 0.8, type1.error = 0.000025 and side = 1.

