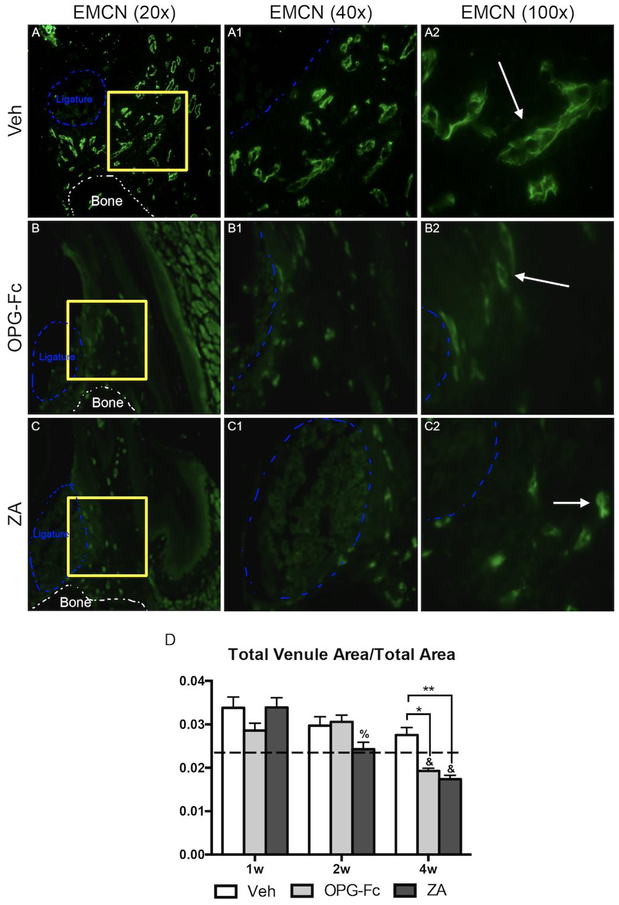
Figure 3: Endomucin Immunofluorescence Staining of Veh, OPG-Fc, and ZA treated animals 4 weeks following Ligature Placement.
A-A2) 20x, 40x, and 100x magnification of EMCN immunofluorescence staining of Veh treated animals. B-B2) 20x, 40x, and 100x magnification of EMCN immunofluorescence staining of OPG-Fc treated animals. C-C2) 20x, 40x, and 100x magnification of EMCN immunofluorescence staining of ZA treated animals. D) Quantification of the Total Venule Area/Total area. The white dotted lines outline the bone and the blue dotted line outlines the ligature. Data represents mean value ± SEM. **** = statistical significance p<0.0001, *** = statistical significance p<0.001, ** = statistical significance p<0.01, * = statistical significance p<0.05. % statistical significance p<0.05 vs 1w. & = statistical significance p<0.05 vs 1w and 2w. # = statistical significant vs. 1w.

