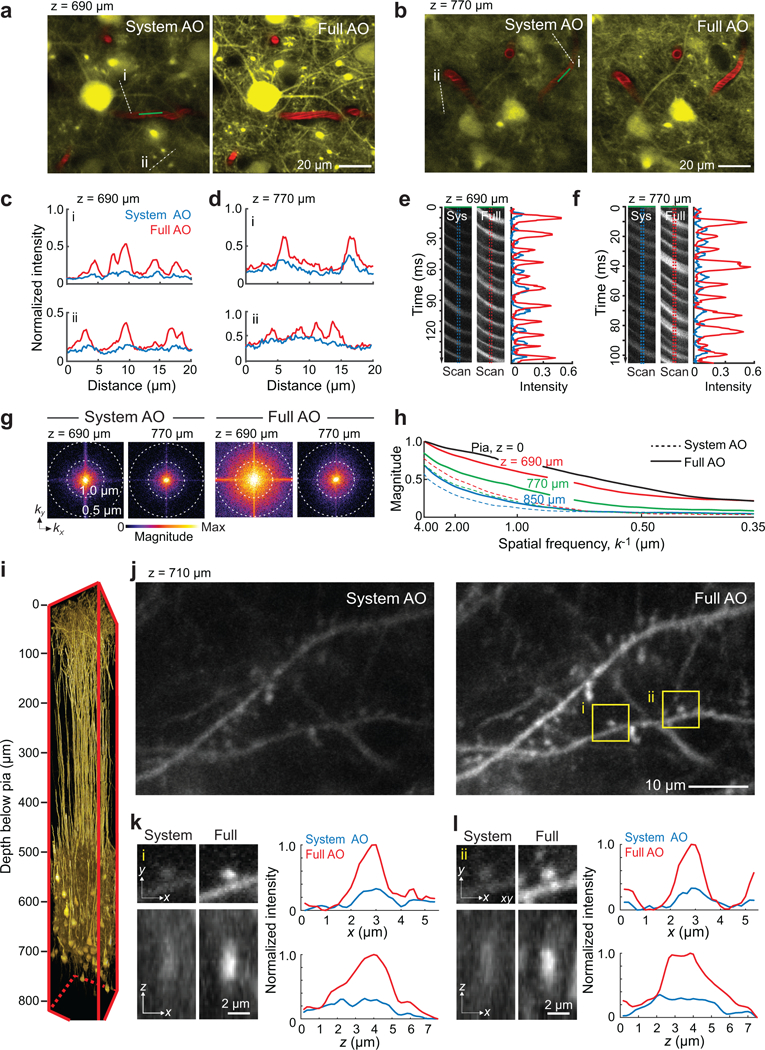
Figure 2. Adaptive optics correction with wavefront sensing from microvessels enable imaging of dendritic spines and blood velocity at layer 5 in mouse vS1 cortex in vivo.

(a,b) Imaging at 690 μm (panel a) and 770 μm (panel b) below the pia in vibrissa primary sensory (vS1) cortex of a Thy1-YFP SLICK A mouse with at λ = 1.04 μm excitation. Image with System (left) and Full AO (right) correction.
(c,d) Signal profiles along the white dashed lines in panels a and b to compare between System AO (blue line) and Full AO (red line).
(e,f) Line scan signals along the green line through the blood vessels in panels a and b compared between System (left) and Full (right) AO, along with signal profiles
(g) Spectral power as a function of spatial frequency, k, for the images in panels a and d.
(h) |k|-space plot of the spatial frequency from images at the depth of the pia at 690 μm, 770 μm, and 850 μm below the pia with System AO (dashed lines) and Full AO (solid lines). Data from panels a and d and Supplementary Fig. 5b–d.
(i) In vivo imaging of mRuby2 labeled layer 5 pyramidal neurons in a 150×150×810 μm3 volume of vS1 cortex at an excitation wavelength of λ = 1.07 μm. The virus AAV-Flex-mRuby2 was injected into layer 5 of Tg(Rbp4-cre)KL100Gsat mice. Full AO corrections were measured and applied every 50 μm of depth.
(j-l) Imaging of dendritic spines at 710 μm below the pia in the same mouse in panel i with System (left) and Full (right) AO correction. Higher magnification views of post-synaptic spines, which correspond to the boxed regions in panel j, are shown in lateral and axial views in panels k and l along with the corresponding x and z profiles of the intensity.
