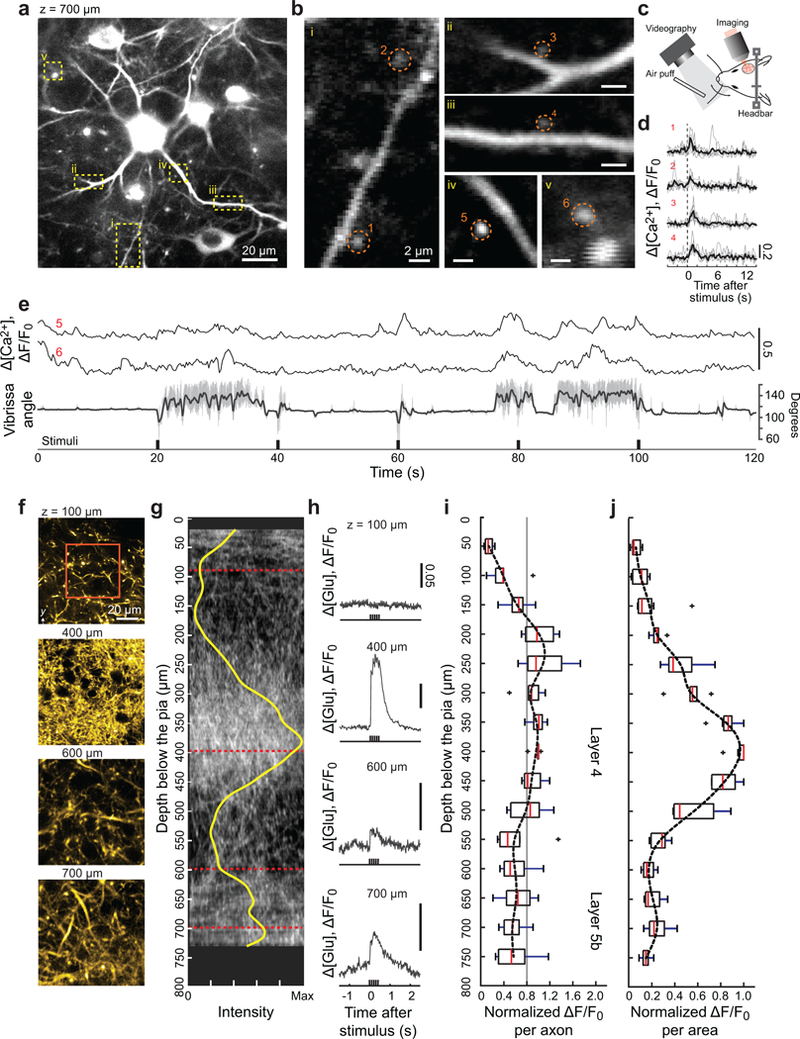
Figure 3. In vivo imaging of calcium and glutamate signaling in dendritic spines and thalamocortical axons in deep layers of vS1 cortex with Full AO correction.

(a) Calcium imaging of L5b basal dendrites and spines at 700 μm below the pia in vS1 cortex at an excitation wavelength of λ = 1.07 μm. The virus AAV-Flex-jRGECO1a was injected into layer 5 of Tg(Rbp4-cre)KL100Gsat mice.
(b) Expanded views of the areas enclosed by the yellow dashed boxes in panel a.
(c) Vibrissa tracking with high-speed camera and air puff stimulation during imaging.
(d,e) Intracellular calcium response of dendritic spines enclosed by red dashed circles in panel b to air-puff stimulation of the C2 vibrissa. The vibrissa is held without whisking for the data of panel d and exhibited free whisking in the data of panel e. For the latter case, the concurrent vibrissa angle (grey) and set-point during rhythmic whisking (dark) are shown. The experiments were repeated in three mice with similar results.
(f-j) Imaging of thalamocortical axons to measure the activation of SF-Venus-iGluSnFR.A184S by glutamate release in response to air-puff stimulation of the vibrissa. Thalamocortical axons were labeled via injection of SF-Venus-iGluSnFR into the barreloids of ventral posterior medial thalamus and imaged at an excitation wavelength of λ = 1.03 μm. The glutamate response was measured every 50 μm from 50 to 730 – 750 μm below the pia in the cortical columns for vibrissae in vS1 cortex. Panel f shows example axons images for the B2 vibrissa cortical column (also see Supplementary Fig. 9b), while panel g shows a 175 μm thick projection in the x-z plane for one animals and the density (yellow) found as an average over all images. Panel h shows the corresponding time-dependent signal of glutamate release, averaged over the region demarked by the red box in panel f. The glutamate responses throughout the measurable depth of the cortical columns for the C1, C2, B2, or B3 vibrissae are shown as a population average of signal per axon in panel i. The gray line serves as a guide to a possible mean response. The same data, recalculated as signal per area, is shown in panel j. Box plots in panels i and j are shown as maximum, minimum, third quartile, first quartile and median (n = 7). Experiments were carried out on seven cortical columns across four mice.
