
Fig. 3.
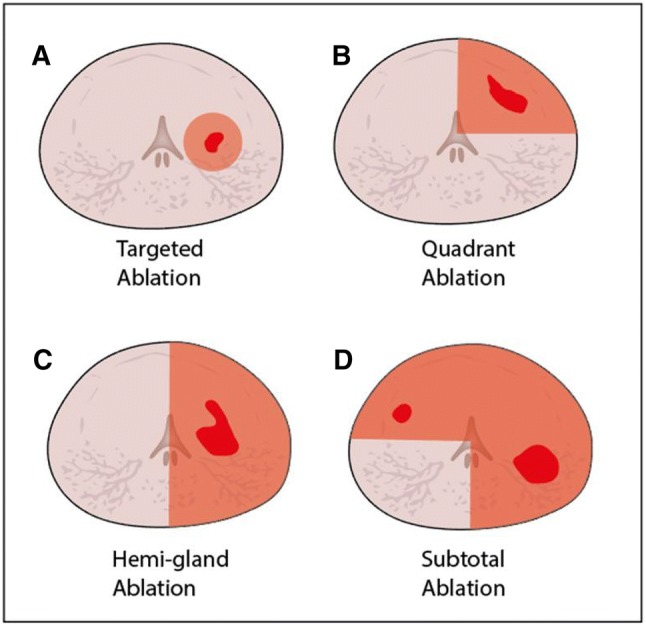
Axial schematic views of prostate gland with cancer foci (in red) and ablation zones (in orange); a targeted ablation, b quadrant ablation, c hemi-gland ablation, and d subtotal ablation
Official websites use .gov
A
.gov website belongs to an official
government organization in the United States.
Secure .gov websites use HTTPS
A lock (
) or https:// means you've safely
connected to the .gov website. Share sensitive
information only on official, secure websites.
Axial schematic views of prostate gland with cancer foci (in red) and ablation zones (in orange); a targeted ablation, b quadrant ablation, c hemi-gland ablation, and d subtotal ablation