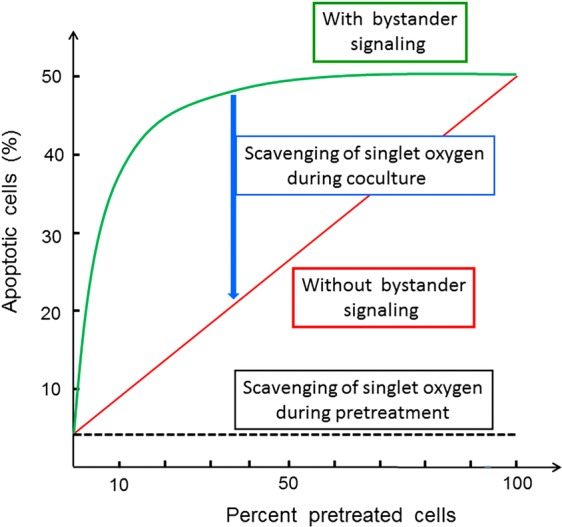
Figure 6.

Interpretation of the results from bystander experiments. If a tested population of pretreated cells shows apoptotic potential, but no bystander effect induction, the dependency of apoptosis induction on the percentage of pretreated cells is a strict line. In the case of bystander signaling, the resultant curve is hyperbolic. It can be reduced to the linear relationship when inhibitors of bystander signaling (such as the singlet oxygen scavenger histidine or other relevant inhibitors) are present during the coculture phase. If pretreatment of tumor cells is a singlet oxygen-dependent pathway as well (as in the case of CAP and PAM), the presence of certain inhibitors will neither allow apoptosis induction nor bystander induction. If the number of bystander inducing cells in the pretreated population is low, the hyperbolic curve will be shifted more to the right, thus allowing quantitation of the bystander-inducing population.
