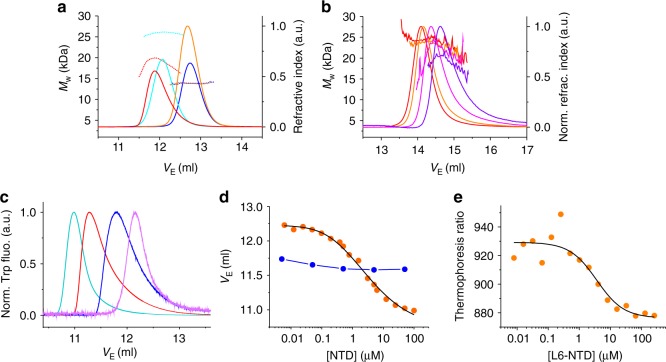
Fig. 3.
NTD dimerization assays. a SEC-MALS of L6-NTD and WT-NTD. SEC elution bands (solid lines) and corresponding average values of Mw (broken lines) measured by MALS are shown. L6-NTD and WT-NTD measured at pH 7.0 (200 mM ionic strength) are shown in orange and blue. L6-NTD and WT-NTD measured at pH 6.0 (60 mM ionic strength) are shown in red and cyan. b SEC-MALS of 12 µM (red), 4 µM (orange), 1.2 µM (magenta), and 0.4 µM (blue) L6-NTD measured at pH 6.0 (8 mM ionic strength). Signals of elution bands are normalized to peak intensities. c High-resolution SEC of 100 µM (cyan), 6 µM (red), 0.8 µM (blue), and 0.05 µM (violet) L6-NTD measured using Trp fluorescence detection. Signals of elution bands are normalized to peak intensities. d VE of L6-NTD (orange) and WT-NTD (blue) measured at pH 6.0 (20 mM ionic strength) and at various protein concentrations using a high-resolution SEC. The black line is a fit to the data using a thermodynamic model for a monomer/dimer equilibrium. e Thermophoresis ratio of fluorescently modified L6-NTD-Q50C in presence of increasing concentration of L6-NTD (orange). The black line is a fit using a model for a binding isotherm. Differences in absolute peak values of VE of elution bands shown in panels (a–c) originate from the different SEC columns used in these experiments. Source data are provided as Source Data file

