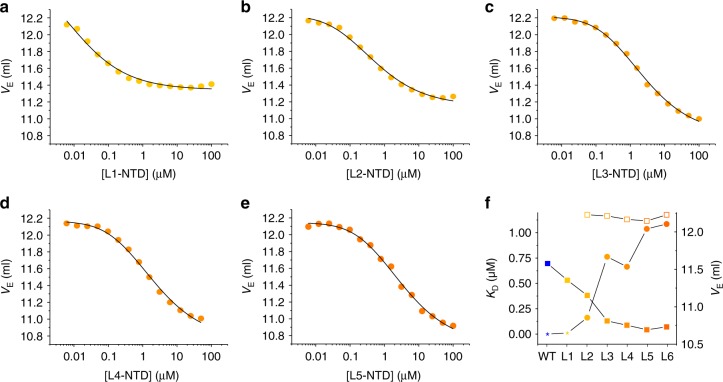
Fig. 4.
Dimerization of cumulative Met-to-Leu mutants. a–e VE plotted versus protein concentration of cumulative Met-to-Leu mutants L1 to L5 measured using high-resolution SEC. The black lines are fits to the data using a thermodynamic model for a monomer/dimer equilibrium. f Values of Kd (spheres) and end-point values of VE (squares) of cumulative Met-to-Leu mutants (L1 to L6) and of WT-NTD measured using high-resolution SEC. The Kd of WT-NTD is the value determined from kinetics reported in ref. 11. The KD of L1 is an estimate because of the non-defined monomer baseline. Closed and open squares are end-point VE values of dimer and monomer, respectively. The end-point values of VE of the WT-NTD monomer and of the L1-NTD monomer could not be determined because their Kd was too low to enter baseline region. Source data are provided as Source Data file

