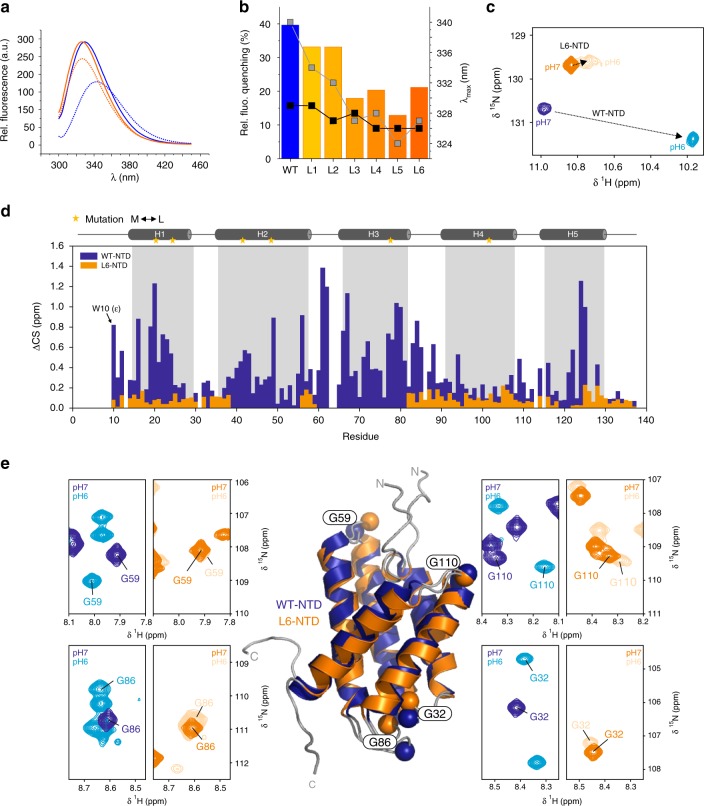
Fig. 5.
Native-state conformational changes of the NTD. a Trp fluorescence spectra of WT-NTD (blue) and L6-NTD (orange) measured at pH 7.0 and 200 mM ionic strength (solid lines), and at pH 6.0 and 8 mM ionic strength (dashed lines). b Quenching of Trp fluorescence emission of cumulative Met-to-Leu mutants upon change of solution condition from pH 7.0 (200 mM ionic strength) to pH 6.0 (8 mM ionic strength) (colored bars). The wavelengths of maximal fluorescence emission at pH 7.0 (gray squares) and at pH 6.0 (black squares) is shown for each mutant. c 1H, 15N-HSQC NMR spectra detailing the side chain amide signal of W10 of L6-NTD and WT-NTD in pH 7.0 buffered solution and 200 mM ionic strength (orange and blue, respectively) and in pH 6.0 and 8 mM ionic strength (light orange and cyan, respectively). d NMR chemical shift (CS) differences of assigned residues in the WT-NTD (blue) and L6-NTD (orange) upon change of solution pH from 7.0 to 6.0. e 1H, 15N-HSQC NMR signals of NTD loop residues. Close up of the HSQC spectral regions of glycine residues G59, G86, G110, and G32 located in loop segments connecting helices of WT-NTD and L6-NTD recorded at pH 7.0 and at pH 6.0 are shown. The location of residues on the aligned structures of WT (blue) and L6-NTD (orange) is highlighted as spheres. Source data are provided as Source Data file. Source data shown in panel e are provided in the BMRB (entry: 27683)

