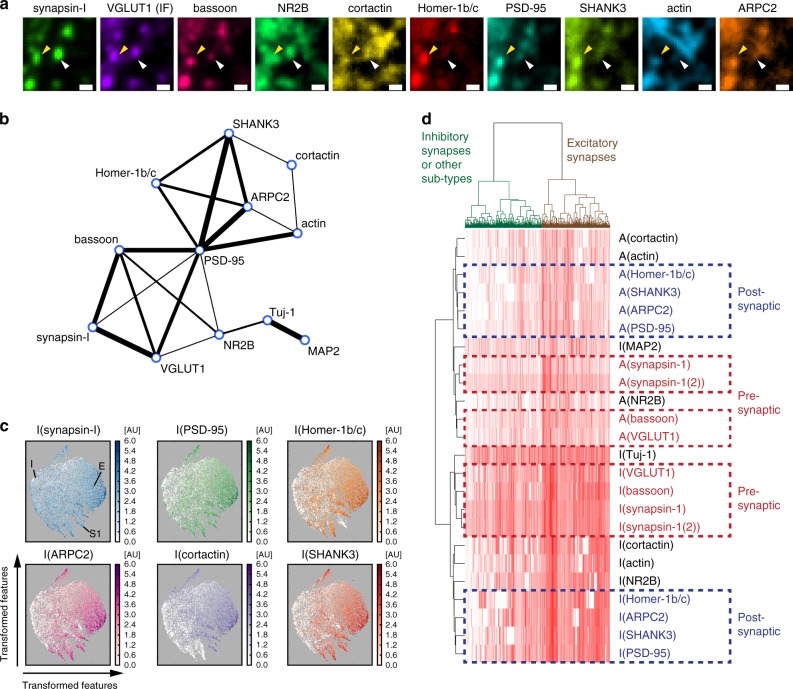
Fig. 4.
Analysis of single-synapse profiles from confocal imaging. a LNA-PRISM images of a conventional excitatory synapse (yellow arrowhead) with co-localization of every synaptic marker measured, and a synapse with only a subset of markers present (white arrowhead). Scale bar: 1 μm. b Network representation of correlations between intensity levels of synaptic proteins within synapses (n = 178,528 synapses from three cell culture batches). The thickness of each edge represents the relative correlation strength between the respective nodes. c t-Distributed Stochastic Neighbor Embedding (t-SNE) plots of n = 10,000 synapses from a single culture batch; each with 20 features (intensity levels and punctae sizes of ten synaptic proteins). Each point in each t-SNE map represents a single synapse with its (x,y) coordinates corresponding to the transformed features that best preserve the distribution of synapses in the original high dimensional feature space. Intensity levels of individual proteins are color-coded in each map. E: cluster of conventional excitatory synapses with the presence of most synaptic markers; I: cluster of possible inhibitory synapses with the absence of most synaptic markers; S: cluster of possible sub-type synapses with the presence of only a subset of synaptic markers. d Hierarchical clustering analysis of synapse profiles. Each column in the heat map represents a profile of a single synapse with 24 synaptic features (rows). I and A denote image intensity level and punctum size, respectively (n = 53,698 synapses from a single culture batch)

