Fig. 6.
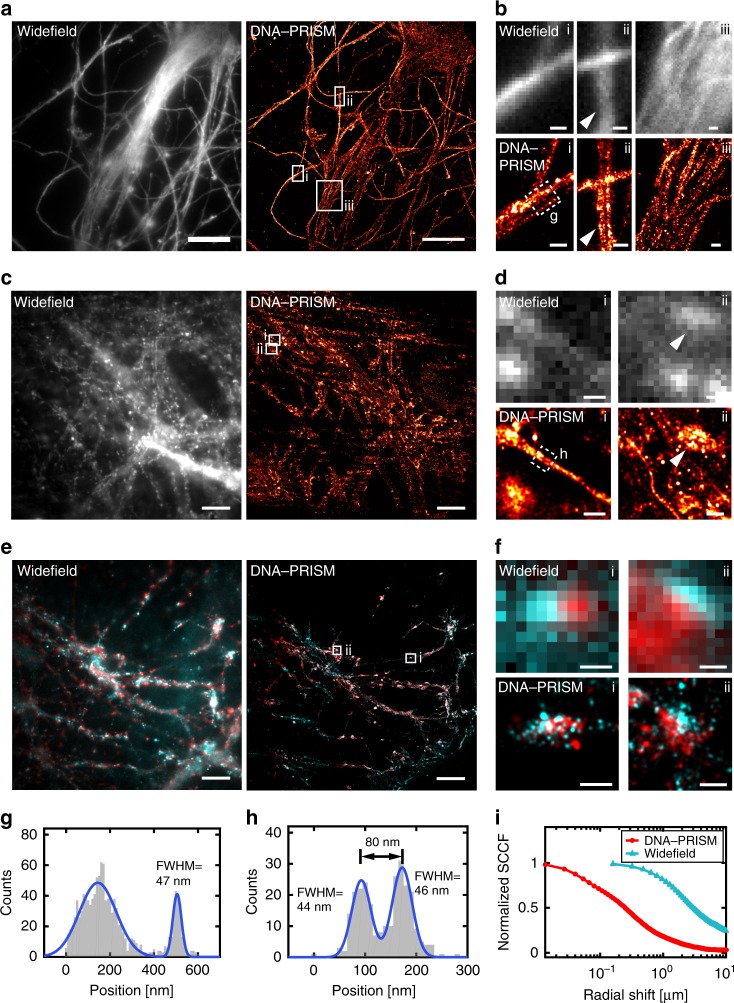
Super-resolution DNA-PRISM imaging of primary neuronal cultures. a Widefield and DNA-PRISM images of neuronal microtubules stained using the DNA-conjugated anti-Tuj-1 antibody. b Zoom-in view of the boxed areas in (a) show resolution enhancement of DNA-PRISM images compared with widefield images. The arrowhead indicates distinct microtubule bundles that are not resolved in the widefield image. c Widefield and DNA-PRISM images of filamentous actin stained using DNA-conjugated phalloidin. d Zoom-in views of the boxed areas in c show two actin filaments (left) and the synaptic actin punctae with sub-synaptic structures (right, arrowhead) that are not resolved in widefield images. e Widefield and DNA-PRISM images of pre-synaptic marker synapsin-I (red) and post-synaptic marker PSD-95 (cyan) of the same field of view. f Zoom-in view of single synapses indicated by boxes in e. g Cross-sectional profile of the boxed region in (b) shows a microtubule bundle next to a possible single microtubule with FWHM = 47 nm. h Cross-sectional profile of the boxed region in d shows two actin filaments or small filament bundles that are 80 nm apart. i The average size of synapses defined by synapsin-I and PSD-95 is quantified using the normalized radial cross-correlation function. The decay at the smaller radial shift of the DNA-PRISM curve (red) indicates the smaller synapse size in the DNA-PRISM image due to the improved spatial resolution. Scale bar: a, c, e 10 μm; b, d, f 0.5 μm

