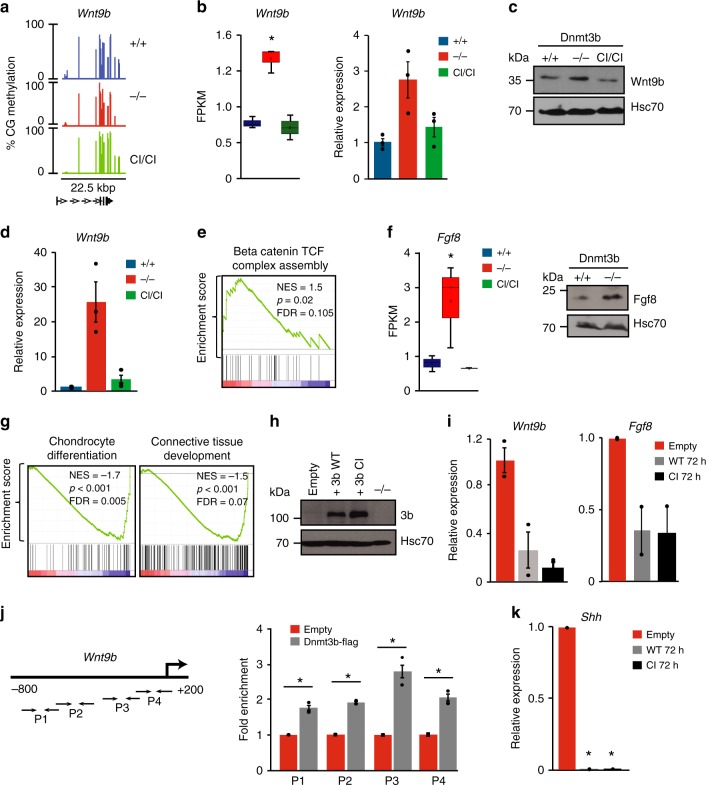
Fig. 7.
Dnmt3b represses Wnt9b and Shh in vivo and in vitro. a Methylation of Wnt9b locus in E11.5 embryos of indicated genotypes determined by RRBS. b Wnt9b expression by RNA-seq (n = 3; *p < 0.05 by DESeq; left) and real-time qRT-PCR (n = 3; normalized to Gapdh; right) in E11.5 embryos. Horizontal line represents median, bounds of box—likely range of variation and whiskers—min and max values. c Immunoblot of Wnt9b and Hsc70 levels in E11.5 embryos. d Wnt9b expression by real-time qRT-PCR in fetal brain of E11.5 embryos (n = 3), normalized to Gapdh. e GSEA using RNA-seq data shows positive enrichment in Beta-catenin–TCF complex assembly in E11.5 Dnmt3b−/− embryos (n = 3). Normalized enrichment scores (NES), false discovery rate (FDR) and p values are shown. f Left. Fgf8 expression by RNA-seq in Dnmt3b+/+, Dnmt3b−/−, and Dnmt3bCI/CI E11.5 embryos (n = 3), *p < 0.05 (DESeq). Horizontal line represents median, bounds of box—likely range of variation and whiskers—min and max values. Right. Immunoblot analysis of Fgf8 levels in E11.5 embryos. g GSEA shows negative enrichment in developmental pathways in E11.5 Dnmt3b−/− embryos relative to Dnmt3b+/+ (n = 3). h Dnmt3b and Hsc70 expression in mouse Dnmt3b−/− T cell lymphoma cells (−/−) 72 h after transduction with lentiviruses expressing control vector (empty), Dnmt3bWT (3b WT), Dnmt3bCI (3b CI) as analyzed by immunoblot. i Real-time qRT-PCR analysis of Wnt9b and Fgf8 expression in samples prepared as in h. Average of two independent experiments normalized to β-actin. j Left: Schematic of mouse Wnt9b promoter with position of primers (arrows): P1: −763/−582 bp, P2: −603/−411 bp; P3: −342/−127 bp; P4: −143/ + 36 bp relative to TSS. Right: Real-time qRT-PCR on DNA immunoprecipitated with anti-FLAG antibody from Dnmt3b−/− lymphoma cells expressing FLAG tagged Dnmt3bWT or empty vector. Data are shown as averaged fold enrichment over empty vector (n = 2), *p < 0.001 (two-tailed Student’s t-test). Assay was performed in triplicates and normalized to the input DNA. k Shh expression by real-time qRT-PCR in samples described in h. Averaged data of two independent experiments were normalized to β-actin, *p < 0.001 (two-tailed Student’s t-test). Data in figures b, d, i, j, and k are presented as means ± SEM. Source data are provided as a Source Data file

