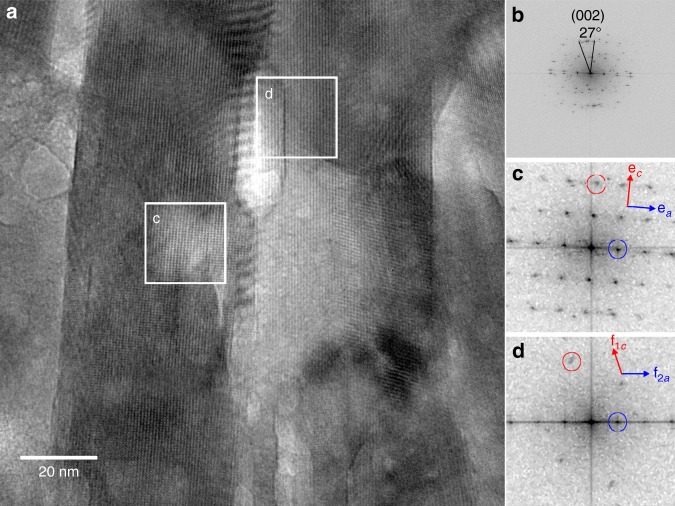
Fig. 4.
Crystal orientations of a thin section within a human outer enamel rod showing c-axis misorientation by 23°, 27°, and >18°. a HR-TEM micrograph taken from a 130 nm × 130 nm × 100 nm volume within an outer enamel rod, with crystals elongated in plane from top to bottom in (a) (termed vertical hereafter). b Fast Fourier transform (FFT) analysis of the entire image in (a), showing that two of the crystals within this entire volume have their c-axes mis-oriented by 27°. e, f FFT power spectra extracted from (c) and (d) in (a), which include crystals with their (100) planes almost parallel and vertical. In e and f red circles and arrows identify (002) spacings and c-axis directions, respectively; blue circles and blue arrows identify (100) spacings and directions of a-axes, respectively. The (e) FFT indicates the presence of a single crystal of carbonated apatite with its c-axis oriented 5° clockwise from the vertical and its a-axis at 90° from the c-axis as expected for apatite. The (f) FFT indicates the presence of two overlapping crystals, f1 and f2. The a-axis of crystal f1 is horizontal (blue circle). No (001) lattice fringes were detected for f1, thus its c-axis is out of the image plane in (a). The c-axis of crystal f2 is oriented at 18° counterclockwise from the vertical (red circle). No (100) lattice fringes were detected for f2, thus its a-axis is out of the image plane in (a). Crystal f2 is oriented with its c-axis 18° counterclockwise from the vertical, thus the angle between the c-axes of crystals f1 and f2 is at least 18°, but it could be as large as 90°. The c-axes of crystals e and f2 are 18° + 5° = 23° apart. Since enamel crystals are on average 26 nm × 63 nm in cross-section18, the 30-nm wide crystals at the center of the image in (a) must be oriented nearly edge-on. Since this section is 100 nm thick, all three crystals identified in the FFTs are either in close proximity to or directly abutting one another. Thus, the c-axes of crystals in close proximity are 23°, 27° and somewhere between 18° and 90° apart. Supplementary Fig. 5 shows where the tooth sample was FIBed to extract this thin section

