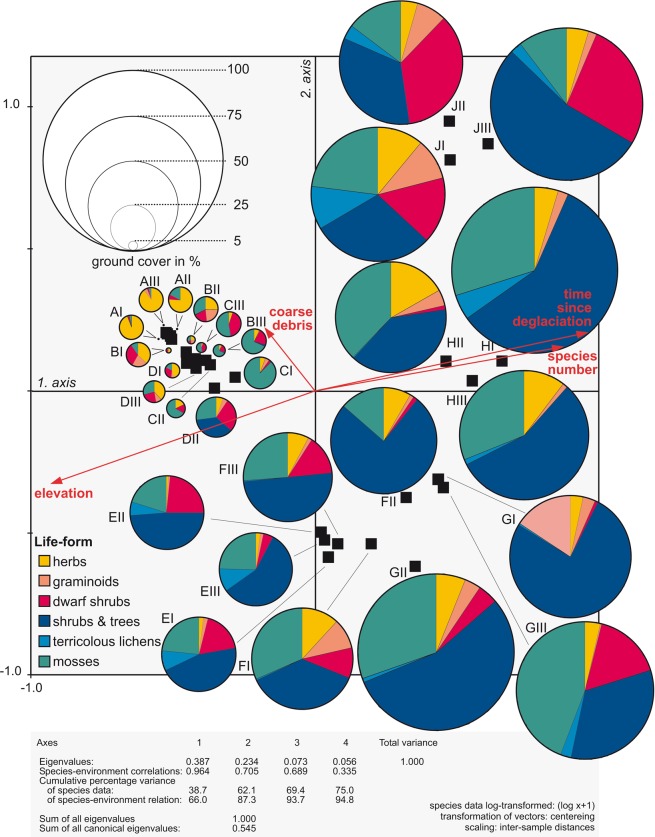
Figure 4.
PCA scatter plot of the chronosequence samples in the glacier foreland of Jamtalferner, based on species composition to depict the floristic similarity between samples (the closer located the black sample-symbols within the ordination space, the higher the similarity). The superimposed pies indicate life form composition and total ground cover of the samples. Where necessary (A, B, and CIII), pies are zoomed for better reading.

