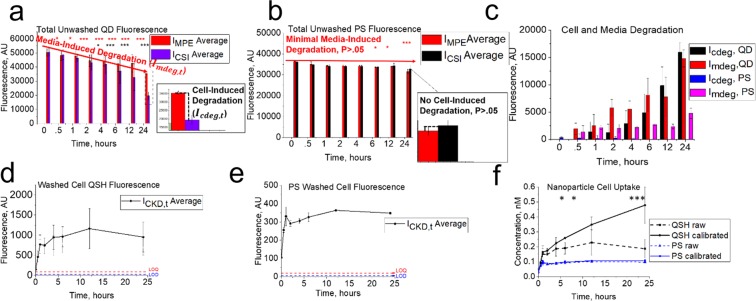
Figure 2.
Fluorescence data from cell kinetic studies for 0, .5, 1, 2, 4, 6, 12, and 24 hours. Total fluorescence for wells with (CSI) and without (MPE) cells exposed to 10 nM for (a) QSH and (b) PS. Fluorescence intensities ICSI,t and IMPE,t for (a) differ significantly (P < 0.05) for QSH at approximately 4 hours, indicating cell-induced cellular induced degradative effects. Fluorescence intensities IMPE,t and IMPE,0 differ significantly from 30 minutes, indicating media degradation at this time. For PS (b), no significant cell induced degradation is present (P > 0.05). Media induced degradation begins at 6 hours (P < 0.05). Differences between ICSI,t and IMPE,t and IMPE,t with IMPE,0 were plotted in (b), showing a steady increase for QSH and constant intensity for PS. Media (Imdeg) and cell (Icdeg) induced degradative values were calculated from (a, b) and plotted against time in (c). Fluorescence intensities were taken after washing 2X with complete growth medium and further trypsinization for (d) QSH and (e) PS. Cell fluorescence values from CKD (d,e) were ally used to determine concentration (nM) of QSH and PS NM uptake/adsorption in (f). The calibrated concentration of QSH (black, solid) shows significantly higher values (P < 0.05) than raw values (black, dashed). However, PS does not degrade, so calibrated (blue, solid) and raw (blue, dashed) concentrations are not significantly different. Statistical t-test p-values are described as follows: ***P < 0.001, **P < .01, and *P < 0.05.

